
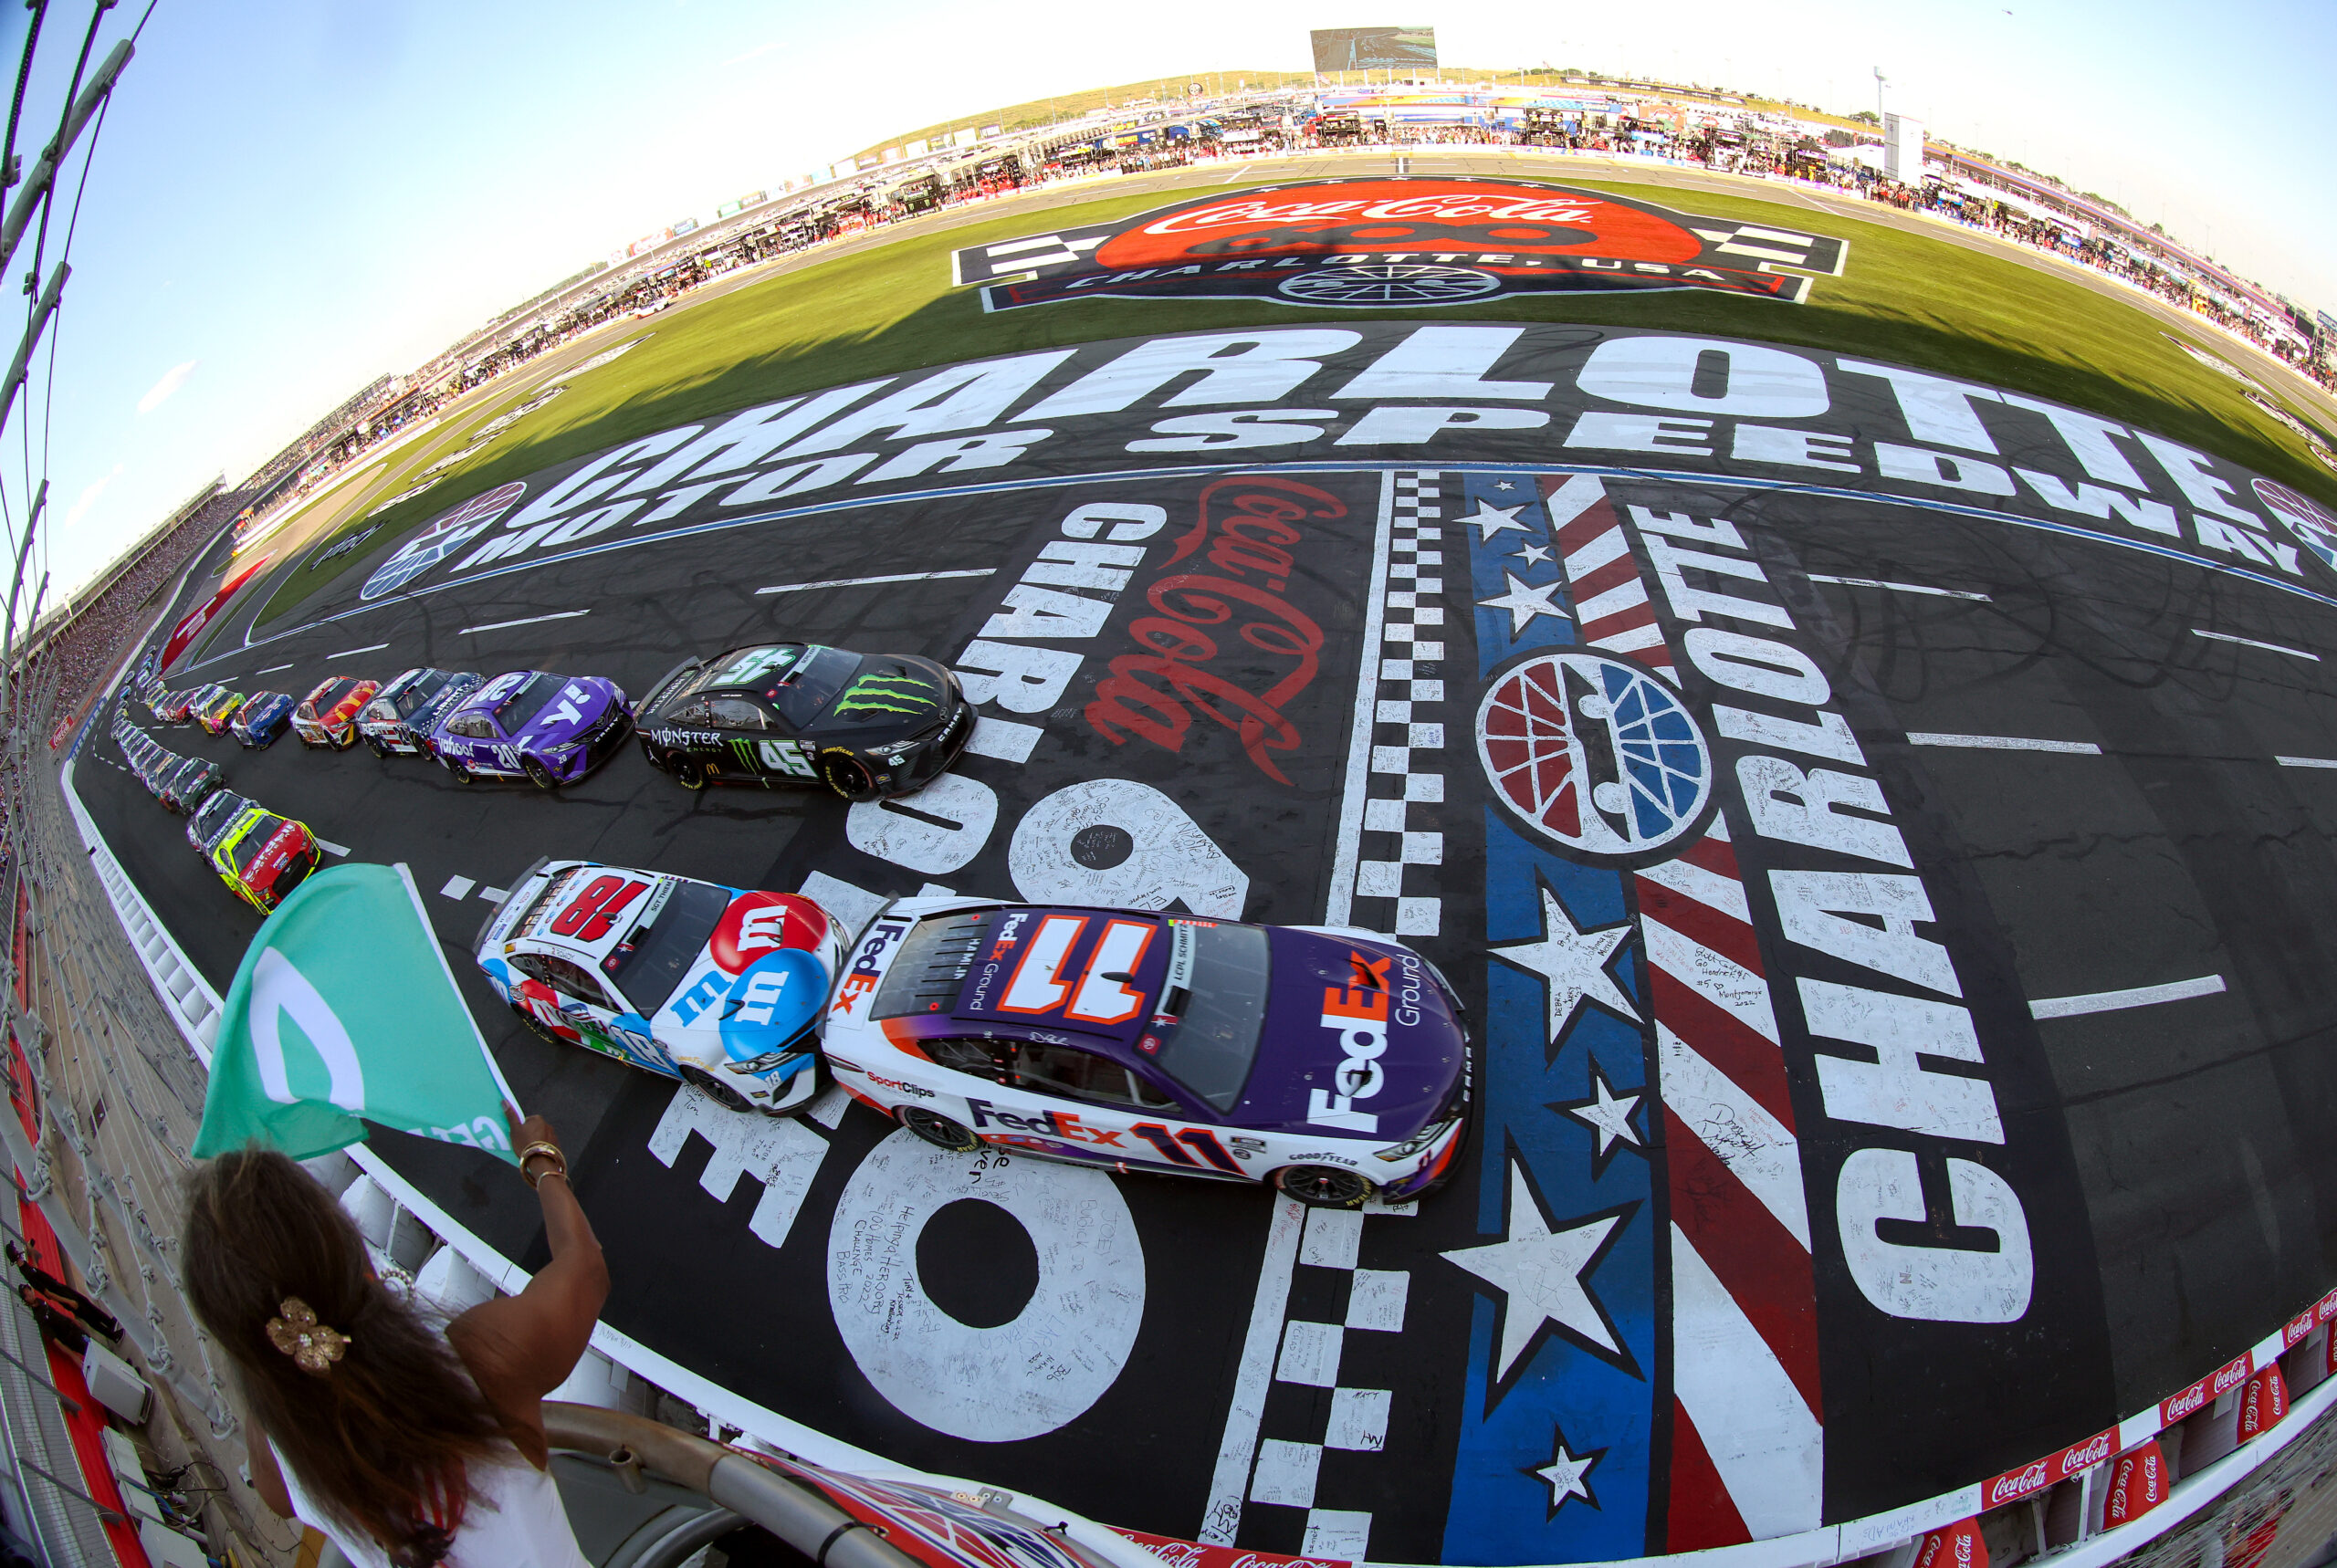
Coca Cola 600 at Charlotte Motor Speedway
Front Runners highlights the drivers that lead laps, run fast laps, and run inside the top 10, 5, & 3 the most at correlated track types.
There is no need to get fancy with Charlotte. The track is a 1.5-mile high speed quad-oval. Its best comparable tracks are Las Vegas, Kansas, and Texas. Certainly some other tracks show correlation but those are the big ones. So those are the ones I’m focusing on this week. Although Charlotte historically has significantly less tire wear than Las Vegas or Kansas, Goodyear will be bringing the same tire as it did at Kansas two weeks ago.
Below are a number of charts that cover driver performance at the 1.5-mile tri/quad-ovals over the past year. We have three data sets to look at, first, the last six races on 1.5-mile tri/quad-ovals. Next we have just data from the 2023 season and finally data from all eight points paying races on 1.5-mile tri-ovals in the Gen 7 car. The charts below are sorted by percentage of laps led by default. There are also a few more columns that you can choose to display, including number of finishes inside the Top 10, 5, 3, and wins as well as total laps completed but for ease of display those columns are hidden by default.
Laps run inside the Top 10, 5, 3, and led as percentage laps driver completed at Charlotte (2022), Texas (2022), Las Vegas (2022-2 and 2023-1), and Kansas (2022-2 and 2023-1)
Laps run inside the Top 10, 5, 3, and led as percentage laps driver completed at 1.5-mile tri-ovals in 2023 (Las Vegas 1 and Kansas 1)
| wdt_ID | Driver | Races | T10 Fin | T10 Laps | T10% | T5 Fin | T5 Laps | T5% | T3 Fin | T3 Laps | T3% | Wins | Led | LL% | Fast Laps | FL% | Laps Run | % Laps Run |
|---|---|---|---|---|---|---|---|---|---|---|---|---|---|---|---|---|---|---|
| 1 | Kyle Larson | 2 | 2 | 470 | 87.36 | 2 | 412 | 76.58 | 2 | 392 | 72.86 | 0 | 148 | 27.51 | 70 | 15.98 | 538 | 100.00 |
| 2 | Denny Hamlin | 2 | 1 | 516 | 95.91 | 1 | 371 | 68.96 | 1 | 268 | 49.81 | 1 | 44 | 8.18 | 55 | 12.56 | 538 | 100.00 |
| 3 | William Byron | 2 | 2 | 388 | 72.12 | 2 | 353 | 65.61 | 2 | 314 | 58.36 | 1 | 186 | 34.57 | 76 | 17.35 | 538 | 100.00 |
| 4 | Martin Truex Jr | 2 | 2 | 500 | 92.94 | 0 | 316 | 58.74 | 0 | 164 | 30.48 | 0 | 82 | 15.24 | 36 | 8.22 | 538 | 100.00 |
| 5 | Ross Chastain | 2 | 1 | 475 | 88.29 | 1 | 280 | 52.04 | 0 | 120 | 22.30 | 0 | 4 | 0.74 | 11 | 2.51 | 538 | 100.00 |
| 6 | Christopher Bell | 2 | 1 | 315 | 58.55 | 1 | 155 | 28.81 | 0 | 29 | 5.39 | 0 | 3 | 0.56 | 14 | 3.20 | 428 | 79.55 |
| 7 | Bubba Wallace | 2 | 2 | 483 | 89.78 | 2 | 148 | 27.51 | 0 | 56 | 10.41 | 0 | 9 | 1.67 | 24 | 5.48 | 538 | 100.00 |
| 8 | Tyler Reddick | 2 | 1 | 214 | 39.78 | 0 | 101 | 18.77 | 0 | 57 | 10.59 | 0 | 25 | 4.65 | 16 | 3.65 | 538 | 100.00 |
| 9 | Ty Gibbs | 2 | 0 | 151 | 28.07 | 0 | 78 | 14.50 | 0 | 19 | 3.53 | 0 | 0 | 0.00 | 12 | 2.74 | 446 | 82.90 |
| 10 | Daniel Suarez | 2 | 1 | 167 | 31.04 | 0 | 46 | 8.55 | 0 | 1 | 0.19 | 0 | 0 | 0.00 | 7 | 1.60 | 538 | 100.00 |
| 11 | Joey Logano | 2 | 1 | 145 | 26.95 | 0 | 46 | 8.55 | 0 | 27 | 5.02 | 0 | 17 | 3.16 | 4 | 0.91 | 450 | 83.64 |
| 12 | Chase Elliott | 1 | 1 | 127 | 23.61 | 0 | 39 | 7.25 | 0 | 19 | 3.53 | 0 | 5 | 0.93 | 11 | 2.51 | 267 | 49.63 |
| 13 | Ryan Blaney | 2 | 0 | 248 | 46.10 | 0 | 31 | 5.76 | 0 | 10 | 1.86 | 0 | 0 | 0.00 | 7 | 1.60 | 538 | 100.00 |
| 14 | Brad Keselowski | 2 | 0 | 199 | 36.99 | 0 | 26 | 4.83 | 0 | 16 | 2.97 | 0 | 5 | 0.93 | 6 | 1.37 | 538 | 100.00 |
| 15 | Austin Dillon | 2 | 1 | 88 | 16.36 | 0 | 17 | 3.16 | 0 | 9 | 1.67 | 0 | 0 | 0.00 | 0 | 0.00 | 536 | 99.63 |
| 16 | Michael McDowell | 2 | 0 | 42 | 7.81 | 0 | 16 | 2.97 | 0 | 15 | 2.79 | 0 | 1 | 0.19 | 12 | 2.74 | 536 | 99.63 |
| 17 | Corey LaJoie | 2 | 0 | 25 | 4.65 | 0 | 12 | 2.23 | 0 | 9 | 1.67 | 0 | 7 | 1.30 | 1 | 0.23 | 537 | 99.81 |
| 18 | Erik Jones | 2 | 0 | 22 | 4.09 | 0 | 11 | 2.04 | 0 | 2 | 0.37 | 0 | 0 | 0.00 | 2 | 0.46 | 537 | 99.81 |
| 19 | Noah Gragson | 2 | 0 | 19 | 3.53 | 0 | 11 | 2.04 | 0 | 6 | 1.12 | 0 | 0 | 0.00 | 6 | 1.37 | 531 | 98.70 |
| 20 | JJ Yeley | 2 | 0 | 18 | 3.35 | 0 | 11 | 2.04 | 0 | 2 | 0.37 | 0 | 0 | 0.00 | 1 | 0.23 | 531 | 98.70 |
| 21 | Ryan Preece | 2 | 0 | 19 | 3.53 | 0 | 9 | 1.67 | 0 | 3 | 0.56 | 0 | 0 | 0.00 | 0 | 0.00 | 536 | 99.63 |
| 22 | Kyle Busch | 2 | 0 | 215 | 39.96 | 0 | 7 | 1.30 | 0 | 0 | 0.00 | 0 | 0 | 0.00 | 3 | 0.68 | 433 | 80.48 |
| 23 | AJ Allmendinger | 2 | 0 | 13 | 2.42 | 0 | 7 | 1.30 | 0 | 0 | 0.00 | 0 | 0 | 0.00 | 1 | 0.23 | 538 | 100.00 |
| 24 | Todd Gilliland | 2 | 0 | 10 | 1.86 | 0 | 5 | 0.93 | 0 | 1 | 0.19 | 0 | 0 | 0.00 | 2 | 0.46 | 534 | 99.26 |
| 25 | Chris Buescher | 2 | 0 | 11 | 2.04 | 0 | 3 | 0.56 | 0 | 0 | 0.00 | 0 | 0 | 0.00 | 9 | 2.05 | 537 | 99.81 |
| 26 | Austin Cindric | 2 | 1 | 5 | 0.93 | 0 | 2 | 0.37 | 0 | 1 | 0.19 | 0 | 0 | 0.00 | 3 | 0.68 | 531 | 98.70 |
| 27 | BJ McLeod | 1 | 0 | 3 | 0.56 | 0 | 2 | 0.37 | 0 | 0 | 0.00 | 0 | 0 | 0.00 | 0 | 0.00 | 266 | 49.44 |
| 28 | Josh Berry | 2 | 0 | 51 | 9.48 | 0 | 1 | 0.19 | 0 | 0 | 0.00 | 0 | 0 | 0.00 | 0 | 0.00 | 535 | 99.44 |
| 29 | Justin Haley | 2 | 1 | 8 | 1.49 | 0 | 1 | 0.19 | 0 | 0 | 0.00 | 0 | 0 | 0.00 | 8 | 1.83 | 538 | 100.00 |
| 30 | Kevin Harvick | 2 | 1 | 178 | 33.09 | 0 | 0 | 0.00 | 0 | 0 | 0.00 | 0 | 0 | 0.00 | 1 | 0.23 | 538 | 100.00 |
| 31 | Aric Almirola | 2 | 0 | 15 | 2.79 | 0 | 0 | 0.00 | 0 | 0 | 0.00 | 0 | 0 | 0.00 | 4 | 0.91 | 538 | 100.00 |
| 32 | Ty Dillon | 2 | 0 | 8 | 1.49 | 0 | 0 | 0.00 | 0 | 0 | 0.00 | 0 | 0 | 0.00 | 1 | 0.23 | 532 | 98.88 |
| 33 | Chase Briscoe | 2 | 0 | 6 | 1.12 | 0 | 0 | 0.00 | 0 | 0 | 0.00 | 0 | 0 | 0.00 | 0 | 0.00 | 529 | 98.33 |
| 34 | Ricky Stenhouse Jr | 2 | 0 | 6 | 1.12 | 0 | 0 | 0.00 | 0 | 0 | 0.00 | 0 | 0 | 0.00 | 2 | 0.46 | 537 | 99.81 |
| 35 | Harrison Burton | 2 | 0 | 1 | 0.19 | 0 | 0 | 0.00 | 0 | 0 | 0.00 | 0 | 0 | 0.00 | 5 | 1.14 | 530 | 98.51 |
| 36 | Zane Smith | 0 | 0 | 0 | 0.00 | 0 | 0 | 0.00 | 0 | 0 | 0.00 | 0 | 0 | 0.00 | 0 | 0.00 | 0 | 0.00 |
| 37 | Jimmie Johnson | 0 | 0 | 0 | 0.00 | 0 | 0 | 0.00 | 0 | 0 | 0.00 | 0 | 0 | 0.00 | 0 | 0.00 | 0 | 0.00 |
| Driver | Races | T10 Fin | T10 Laps | T10% | T5 Fin | T5 Laps | T5% | T3 Fin | T3 Laps | T3% | Wins | Led | LL% | Fast Laps | FL% | Laps Run | % Laps Run |
Laps run inside the Top 10, 5, 3, and led as percentage laps driver completed at all 1.5-mile tri/quad-ovals in the Gen 7 car (2022 and 2023 though Kansas 1)
Charlotte Front Runners – All 1.5s in Gen 7
| wdt_ID | Driver | Races | T10 Fin | T10 Laps | T10% | T5 Fin | T5 Laps | T5% | T3 Fin | T3 Laps | T3% | Wins | Led | LL% | Fast Laps | FL% | Laps Run | % Laps Run |
|---|---|---|---|---|---|---|---|---|---|---|---|---|---|---|---|---|---|---|
| 1 | Ross Chastain | 8 | 5 | 1,776 | 75.25 | 3 | 1,170 | 49.58 | 2 | 893 | 37.84 | 0 | 313 | 13.26 | 139 | 7.73 | 2,360 | 100.00 |
| 2 | Austin Cindric | 8 | 1 | 547 | 23.18 | 0 | 198 | 8.39 | 0 | 43 | 1.82 | 0 | 9 | 0.38 | 22 | 1.22 | 2,077 | 88.01 |
| 3 | Austin Dillon | 8 | 2 | 374 | 15.85 | 0 | 71 | 3.01 | 0 | 31 | 1.31 | 0 | 3 | 0.13 | 5 | 0.28 | 2,350 | 99.58 |
| 4 | Kevin Harvick | 8 | 2 | 572 | 24.24 | 1 | 81 | 3.43 | 1 | 13 | 0.55 | 0 | 9 | 0.38 | 7 | 0.39 | 2,157 | 91.40 |
| 5 | Kyle Larson | 8 | 7 | 1,596 | 67.63 | 4 | 1,112 | 47.12 | 4 | 898 | 38.05 | 0 | 389 | 16.48 | 155 | 8.62 | 2,187 | 92.67 |
| 6 | Brad Keselowski | 8 | 1 | 419 | 17.75 | 0 | 109 | 4.62 | 0 | 65 | 2.75 | 0 | 40 | 1.69 | 31 | 1.72 | 2,139 | 90.64 |
| 7 | Corey LaJoie | 8 | 0 | 44 | 1.86 | 0 | 24 | 1.02 | 0 | 20 | 0.85 | 0 | 9 | 0.38 | 5 | 0.28 | 2,006 | 85.00 |
| 8 | Kyle Busch | 8 | 4 | 978 | 41.44 | 4 | 508 | 21.53 | 3 | 300 | 12.71 | 0 | 103 | 4.36 | 99 | 5.50 | 1,969 | 83.43 |
| 9 | Chase Elliott | 7 | 2 | 845 | 35.81 | 0 | 436 | 18.47 | 0 | 330 | 13.98 | 0 | 158 | 6.69 | 56 | 3.11 | 1,708 | 72.37 |
| 10 | Aric Almirola | 8 | 1 | 324 | 13.73 | 0 | 53 | 2.25 | 0 | 34 | 1.44 | 0 | 0 | 0.00 | 17 | 0.94 | 2,357 | 99.87 |
| 11 | Denny Hamlin | 8 | 6 | 1,668 | 70.68 | 5 | 1,046 | 44.32 | 3 | 515 | 21.82 | 2 | 98 | 4.15 | 113 | 6.28 | 2,305 | 97.67 |
| 12 | Ryan Blaney | 8 | 2 | 1,280 | 54.24 | 1 | 626 | 26.53 | 0 | 404 | 17.12 | 0 | 83 | 3.52 | 74 | 4.11 | 1,965 | 83.26 |
| 13 | Chase Briscoe | 8 | 3 | 486 | 20.59 | 3 | 327 | 13.86 | 0 | 179 | 7.58 | 0 | 9 | 0.38 | 23 | 1.28 | 2,210 | 93.64 |
| 14 | JJ Yeley | 5 | 0 | 18 | 0.76 | 0 | 11 | 0.47 | 0 | 2 | 0.08 | 0 | 0 | 0.00 | 1 | 0.06 | 1,310 | 55.51 |
| 15 | AJ Allmendinger | 3 | 1 | 42 | 1.78 | 0 | 13 | 0.55 | 0 | 0 | 0.00 | 0 | 0 | 0.00 | 4 | 0.22 | 805 | 34.11 |
| 16 | Chris Buescher | 8 | 0 | 221 | 9.36 | 0 | 38 | 1.61 | 0 | 15 | 0.64 | 0 | 0 | 0.00 | 23 | 1.28 | 2,224 | 94.24 |
| 17 | Martin Truex Jr | 8 | 6 | 1,491 | 63.18 | 1 | 768 | 32.54 | 0 | 418 | 17.71 | 0 | 127 | 5.38 | 134 | 7.45 | 2,293 | 97.16 |
| 18 | Christopher Bell | 8 | 5 | 1,155 | 48.94 | 4 | 594 | 25.17 | 1 | 292 | 12.37 | 0 | 109 | 4.62 | 89 | 4.95 | 1,879 | 79.62 |
| 19 | Harrison Burton | 8 | 0 | 111 | 4.70 | 0 | 56 | 2.37 | 0 | 39 | 1.65 | 0 | 16 | 0.68 | 8 | 0.44 | 2,351 | 99.62 |
| 20 | Joey Logano | 8 | 3 | 1,100 | 46.61 | 2 | 547 | 23.18 | 2 | 362 | 15.34 | 1 | 72 | 3.05 | 59 | 3.28 | 2,264 | 95.93 |
| 21 | Bubba Wallace | 8 | 4 | 961 | 40.72 | 3 | 308 | 13.05 | 1 | 144 | 6.10 | 1 | 39 | 1.65 | 70 | 3.89 | 1,973 | 83.60 |
| 22 | William Byron | 8 | 5 | 1,491 | 63.18 | 3 | 869 | 36.82 | 2 | 598 | 25.34 | 1 | 287 | 12.16 | 137 | 7.62 | 2,138 | 90.59 |
| 23 | Justin Haley | 8 | 2 | 160 | 6.78 | 1 | 64 | 2.71 | 1 | 51 | 2.16 | 0 | 16 | 0.68 | 26 | 1.45 | 2,085 | 88.35 |
| 24 | Michael McDowell | 8 | 1 | 433 | 18.35 | 0 | 188 | 7.97 | 0 | 60 | 2.54 | 0 | 15 | 0.64 | 16 | 0.89 | 2,357 | 99.87 |
| 25 | Zane Smith | 0 | 0 | 0 | 0.00 | 0 | 0 | 0.00 | 0 | 0 | 0.00 | 0 | 0 | 0.00 | 0 | 0.00 | 0 | 0.00 |
| 26 | Ryan Preece | 3 | 0 | 19 | 0.81 | 0 | 9 | 0.38 | 0 | 3 | 0.13 | 0 | 0 | 0.00 | 0 | 0.00 | 552 | 23.39 |
| 27 | Noah Gragson | 7 | 0 | 147 | 6.23 | 0 | 21 | 0.89 | 0 | 8 | 0.34 | 0 | 0 | 0.00 | 11 | 0.61 | 2,052 | 86.95 |
| 28 | Erik Jones | 8 | 2 | 477 | 20.21 | 0 | 143 | 6.06 | 0 | 60 | 2.54 | 0 | 3 | 0.13 | 20 | 1.11 | 2,337 | 99.03 |
| 29 | Tyler Reddick | 8 | 5 | 1,308 | 55.42 | 1 | 713 | 30.21 | 1 | 422 | 17.88 | 1 | 193 | 8.18 | 124 | 6.89 | 2,352 | 99.66 |
| 30 | Ricky Stenhouse Jr | 8 | 2 | 370 | 15.68 | 0 | 95 | 4.03 | 0 | 57 | 2.42 | 0 | 31 | 1.31 | 25 | 1.39 | 2,358 | 99.92 |
| 31 | Josh Berry | 2 | 0 | 51 | 2.16 | 0 | 1 | 0.04 | 0 | 0 | 0.00 | 0 | 0 | 0.00 | 0 | 0.00 | 535 | 22.67 |
| 32 | Todd Gilliland | 8 | 0 | 262 | 11.10 | 0 | 129 | 5.47 | 0 | 76 | 3.22 | 0 | 2 | 0.08 | 4 | 0.22 | 2,354 | 99.75 |
| 33 | Ty Gibbs | 5 | 0 | 163 | 6.91 | 0 | 85 | 3.60 | 0 | 19 | 0.81 | 0 | 0 | 0.00 | 12 | 0.67 | 1,314 | 55.68 |
| 34 | Ty Dillon | 8 | 0 | 68 | 2.88 | 0 | 15 | 0.64 | 0 | 5 | 0.21 | 0 | 1 | 0.04 | 2 | 0.11 | 2,323 | 98.43 |
| 35 | BJ McLeod | 7 | 0 | 8 | 0.34 | 0 | 4 | 0.17 | 0 | 1 | 0.04 | 0 | 1 | 0.04 | 1 | 0.06 | 1,598 | 67.71 |
| 36 | Jimmie Johnson | 0 | 0 | 0 | 0.00 | 0 | 0 | 0.00 | 0 | 0 | 0.00 | 0 | 0 | 0.00 | 0 | 0.00 | 0 | 0.00 |
| 37 | Daniel Suarez | 8 | 2 | 847 | 35.89 | 0 | 443 | 18.77 | 0 | 215 | 9.11 | 0 | 68 | 2.88 | 103 | 5.73 | 2,089 | 88.52 |
| Driver | Races | T10 Fin | T10 Laps | T10% | T5 Fin | T5 Laps | T5% | T3 Fin | T3 Laps | T3% | Wins | Led | LL% | Fast Laps | FL% | Laps Run | % Laps Run |
Thanks for checking out the Front Runners! Let’s WIN THE RACE!