
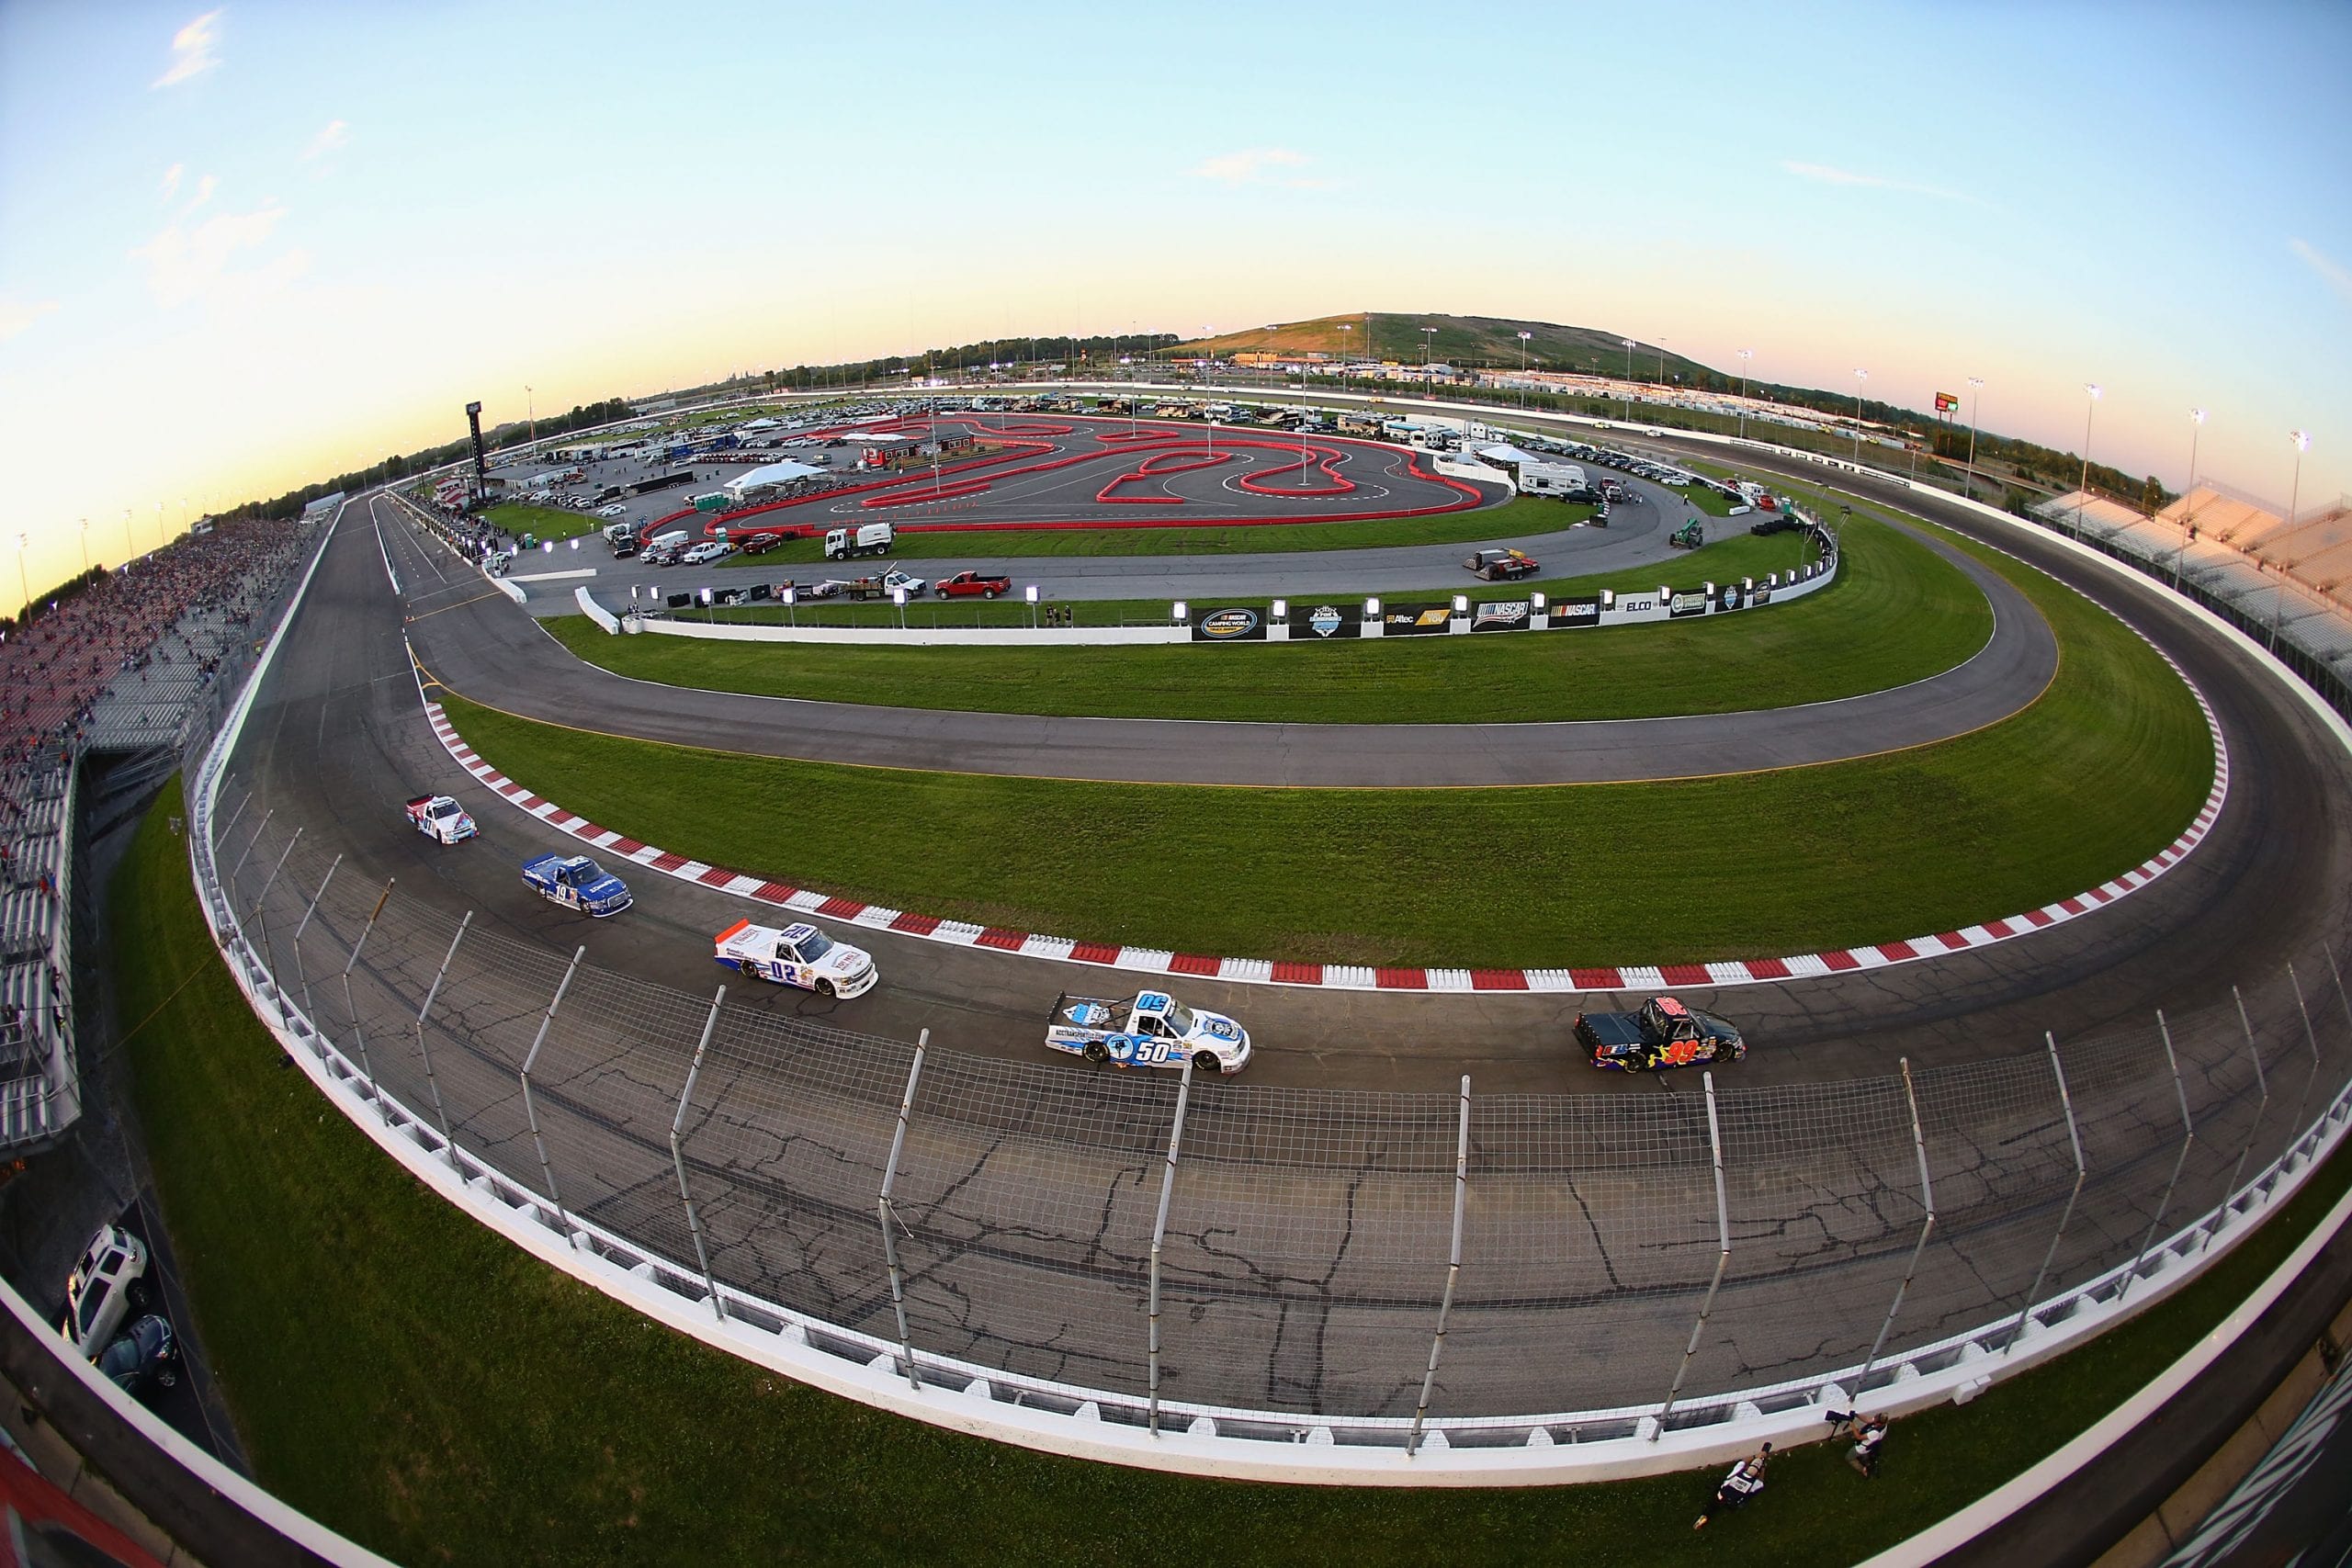
Enjoy Illinois 300 at World Wide Technology Raceway (aka Gateway)
Front Runners highlights the drivers that lead laps, run fast laps, and run inside the top 10, 5, & 3 the most at correlated track types.
Handicapping Gateway presents a new challenge for 2023. The track is a 1.25-mile egg shaped oval, with limited banking and low tire wear. This might lead some to look to the short flat tracks for correlation. In 2022 however there wasn’t particularly meaningful correlation between those tracks and Gateway. In fact, in some cases there was more correlation between the 1.5-mil intermediate tracks. Further complicating matters is that as the track is over 1 mile in length, NASCAR is running the intermediate package, not the short track package used at Phoenix, Richmond, and Martinsville. Conversely, Goodyear will be bringing the same tire as it did to the higher wear short tracks of Phoenix, Richmond, and North Wilkesboro.
Given this blend of equipment its hard to say exactly which tracks will be relevant this weekend. To that end I have updated Front Runners to have four datasets. First, 2022 Gateway only. Second, 2022 Gateway and the next five races which used the same tire code. Third, 2022 Gateway and the following three 2022 races using the same tire code (which would be with the intermediate package since there was no short track package in 2022). Finally, the two 2023 races using the same tire code.
The charts below are sorted by percentage of laps led by default. There are also a few more columns that you can choose to display, including number of finishes inside the Top 10, 5, 3, and wins as well as total laps completed but for ease of display those columns are hidden by default.
Laps run inside the Top 10, 5, 3, and led as percentage laps driver completed at World Wide Technology Raceway (aka Gateway) (2022)
| wdt_ID | Driver | Races | T10 Fin | T10 Laps | T10 % | T5 Fin | T5 Laps | T5% | T3 Fin | T3 Laps | T3 % | Wins | Led | LL % | Fast Laps | FL % | Laps Run | % Laps Run |
|---|---|---|---|---|---|---|---|---|---|---|---|---|---|---|---|---|---|---|
| 1 | Kyle Busch | 1 | 1 | 235 | 95.92 | 1 | 166 | 67.76 | 1 | 151 | 61.63 | 0 | 65 | 26.53 | 46 | 25.41 | 245 | 100.00 |
| 2 | Martin Truex Jr | 1 | 1 | 144 | 58.78 | 0 | 62 | 25.31 | 0 | 50 | 20.41 | 0 | 42 | 17.14 | 16 | 8.84 | 245 | 100.00 |
| 3 | Michael McDowell | 1 | 0 | 112 | 45.71 | 0 | 36 | 14.69 | 0 | 35 | 14.29 | 0 | 34 | 13.88 | 4 | 2.21 | 245 | 100.00 |
| 4 | Chase Briscoe | 1 | 0 | 69 | 28.16 | 0 | 28 | 11.43 | 0 | 27 | 11.02 | 0 | 27 | 11.02 | 7 | 3.87 | 245 | 100.00 |
| 5 | Austin Cindric | 1 | 0 | 181 | 73.88 | 0 | 94 | 38.37 | 0 | 67 | 27.35 | 0 | 25 | 10.20 | 4 | 2.21 | 245 | 100.00 |
| 6 | Joey Logano | 1 | 1 | 158 | 64.49 | 1 | 96 | 39.18 | 1 | 91 | 37.14 | 1 | 22 | 8.98 | 20 | 11.05 | 245 | 100.00 |
| 7 | Ryan Blaney | 1 | 1 | 195 | 79.59 | 1 | 167 | 68.16 | 0 | 118 | 48.16 | 0 | 12 | 4.90 | 38 | 20.99 | 245 | 100.00 |
| 8 | Erik Jones | 1 | 1 | 151 | 61.63 | 0 | 58 | 23.67 | 0 | 7 | 2.86 | 0 | 4 | 1.63 | 0 | 0.00 | 245 | 100.00 |
| 9 | Brad Keselowski | 1 | 0 | 2 | 0.82 | 0 | 1 | 0.41 | 0 | 1 | 0.41 | 0 | 1 | 0.41 | 0 | 0.00 | 245 | 100.00 |
| 10 | AJ Allmendinger | 1 | 1 | 14 | 5.71 | 0 | 0 | 0.00 | 0 | 0 | 0.00 | 0 | 0 | 0.00 | 0 | 0.00 | 245 | 100.00 |
| 11 | Alex Bowman | 1 | 0 | 45 | 18.37 | 0 | 8 | 3.27 | 0 | 0 | 0.00 | 0 | 0 | 0.00 | 0 | 0.00 | 245 | 100.00 |
| 12 | Aric Almirola | 1 | 1 | 238 | 97.14 | 1 | 135 | 55.10 | 0 | 84 | 34.29 | 0 | 0 | 0.00 | 4 | 2.21 | 245 | 100.00 |
| 13 | Austin Dillon | 1 | 0 | 0 | 0.00 | 0 | 0 | 0.00 | 0 | 0 | 0.00 | 0 | 0 | 0.00 | 0 | 0.00 | 245 | 100.00 |
| 14 | BJ McLeod | 1 | 0 | 1 | 0.41 | 0 | 0 | 0.00 | 0 | 0 | 0.00 | 0 | 0 | 0.00 | 0 | 0.00 | 245 | 100.00 |
| 15 | Bubba Wallace | 1 | 0 | 0 | 0.00 | 0 | 0 | 0.00 | 0 | 0 | 0.00 | 0 | 0 | 0.00 | 0 | 0.00 | 245 | 100.00 |
| 16 | Carson Hocevar | 0 | 0 | 0 | 0.00 | 0 | 0 | 0.00 | 0 | 0 | 0.00 | 0 | 0 | 0.00 | 0 | 0.00 | 0 | 0.00 |
| 17 | Chris Buescher | 0 | 0 | 0 | 0.00 | 0 | 0 | 0.00 | 0 | 0 | 0.00 | 0 | 0 | 0.00 | 0 | 0.00 | 0 | 0.00 |
| 18 | Christopher Bell | 1 | 1 | 164 | 66.94 | 0 | 70 | 28.57 | 0 | 8 | 3.27 | 0 | 0 | 0.00 | 12 | 6.63 | 245 | 100.00 |
| 19 | Corey LaJoie | 1 | 0 | 0 | 0.00 | 0 | 0 | 0.00 | 0 | 0 | 0.00 | 0 | 0 | 0.00 | 0 | 0.00 | 72 | 29.39 |
| 20 | Daniel Suarez | 1 | 0 | 84 | 34.29 | 0 | 7 | 2.86 | 0 | 0 | 0.00 | 0 | 0 | 0.00 | 1 | 0.55 | 245 | 100.00 |
| 21 | Denny Hamlin | 1 | 0 | 63 | 25.71 | 0 | 54 | 22.04 | 0 | 0 | 0.00 | 0 | 0 | 0.00 | 2 | 1.10 | 234 | 95.51 |
| 22 | Gray Gaulding | 0 | 0 | 0 | 0.00 | 0 | 0 | 0.00 | 0 | 0 | 0.00 | 0 | 0 | 0.00 | 0 | 0.00 | 0 | 0.00 |
| 23 | Harrison Burton | 1 | 0 | 12 | 4.90 | 0 | 0 | 0.00 | 0 | 0 | 0.00 | 0 | 0 | 0.00 | 0 | 0.00 | 245 | 100.00 |
| 24 | JJ Yeley | 0 | 0 | 0 | 0.00 | 0 | 0 | 0.00 | 0 | 0 | 0.00 | 0 | 0 | 0.00 | 0 | 0.00 | 0 | 0.00 |
| 25 | Justin Haley | 1 | 0 | 7 | 2.86 | 0 | 4 | 1.63 | 0 | 1 | 0.41 | 0 | 0 | 0.00 | 0 | 0.00 | 245 | 100.00 |
| 26 | Kevin Harvick | 1 | 0 | 27 | 11.02 | 0 | 0 | 0.00 | 0 | 0 | 0.00 | 0 | 0 | 0.00 | 0 | 0.00 | 235 | 95.92 |
| 27 | Kyle Larson | 1 | 0 | 48 | 19.59 | 0 | 17 | 6.94 | 0 | 7 | 2.86 | 0 | 0 | 0.00 | 1 | 0.55 | 245 | 100.00 |
| 28 | Noah Gragson | 0 | 0 | 0 | 0.00 | 0 | 0 | 0.00 | 0 | 0 | 0.00 | 0 | 0 | 0.00 | 0 | 0.00 | 0 | 0.00 |
| 29 | Ricky Stenhouse Jr | 1 | 0 | 9 | 3.67 | 0 | 3 | 1.22 | 0 | 0 | 0.00 | 0 | 0 | 0.00 | 2 | 1.10 | 241 | 98.37 |
| 30 | Ross Chastain | 1 | 1 | 143 | 58.37 | 0 | 53 | 21.63 | 0 | 6 | 2.45 | 0 | 0 | 0.00 | 16 | 8.84 | 245 | 100.00 |
| 31 | Ryan Preece | 0 | 0 | 0 | 0.00 | 0 | 0 | 0.00 | 0 | 0 | 0.00 | 0 | 0 | 0.00 | 0 | 0.00 | 0 | 0.00 |
| 32 | Todd Gilliland | 1 | 0 | 3 | 1.22 | 0 | 0 | 0.00 | 0 | 0 | 0.00 | 0 | 0 | 0.00 | 0 | 0.00 | 245 | 100.00 |
| 33 | Ty Dillon | 1 | 0 | 9 | 3.67 | 0 | 0 | 0.00 | 0 | 0 | 0.00 | 0 | 0 | 0.00 | 0 | 0.00 | 245 | 100.00 |
| 34 | Ty Gibbs | 0 | 0 | 0 | 0.00 | 0 | 0 | 0.00 | 0 | 0 | 0.00 | 0 | 0 | 0.00 | 0 | 0.00 | 0 | 0.00 |
| 35 | Tyler Reddick | 1 | 0 | 123 | 50.20 | 0 | 100 | 40.82 | 0 | 63 | 25.71 | 0 | 0 | 0.00 | 4 | 2.21 | 245 | 100.00 |
| 36 | William Byron | 1 | 0 | 10 | 4.08 | 0 | 2 | 0.82 | 0 | 0 | 0.00 | 0 | 0 | 0.00 | 0 | 0.00 | 245 | 100.00 |
| Driver | Races | T10 Fin | T10 Laps | T10 % | T5 Fin | T5 Laps | T5% | T3 Fin | T3 Laps | T3 % | Wins | Led | LL % | Fast Laps | FL % | Laps Run | % Laps Run |
Laps run inside the Top 10, 5, 3, and led as percentage of laps driver completed at 2022 Gateway, 2022 New Hampshire, 2022 Richmond 2, 2022 Phoenix 2, 2023 Phoenix 1, 2023 Richmond 1
| wdt_ID | Driver | Races | T10 Fin | T10 Laps | T10% | T5 Fin | T5 Laps | T5% | T3 Fin | T3 Laps | T3% | Wins | Led | LL% | Fast Laps | FL% | Laps | Laps Run % |
|---|---|---|---|---|---|---|---|---|---|---|---|---|---|---|---|---|---|---|
| 1 | Joey Logano | 6 | 4 | 1,253 | 63.48 | 2 | 887 | 44.93 | 2 | 743 | 37.64 | 2 | 455 | 23.05 | 120 | 7.22 | 1,974 | 99.95 |
| 2 | Kyle Larson | 6 | 3 | 1,551 | 78.61 | 2 | 1,204 | 61.02 | 1 | 978 | 49.57 | 1 | 305 | 15.46 | 142 | 8.54 | 1,973 | 99.90 |
| 3 | Martin Truex Jr | 6 | 3 | 1,239 | 62.73 | 1 | 684 | 34.63 | 0 | 451 | 22.84 | 0 | 270 | 13.67 | 113 | 6.80 | 1,975 | 100.00 |
| 4 | William Byron | 6 | 2 | 1,225 | 62.03 | 1 | 881 | 44.61 | 1 | 619 | 31.34 | 1 | 181 | 9.16 | 128 | 7.70 | 1,975 | 100.00 |
| 5 | Ryan Blaney | 6 | 4 | 1,209 | 61.28 | 3 | 642 | 32.54 | 2 | 417 | 21.14 | 0 | 122 | 6.18 | 134 | 8.06 | 1,973 | 99.90 |
| 6 | Ross Chastain | 6 | 4 | 1,229 | 62.29 | 2 | 530 | 26.86 | 2 | 281 | 14.24 | 0 | 96 | 4.87 | 77 | 4.63 | 1,973 | 99.90 |
| 7 | Denny Hamlin | 6 | 3 | 1,147 | 58.40 | 1 | 649 | 33.04 | 0 | 423 | 21.54 | 0 | 94 | 4.79 | 75 | 4.51 | 1,964 | 99.44 |
| 8 | Kevin Harvick | 6 | 5 | 1,515 | 77.10 | 5 | 810 | 41.22 | 1 | 381 | 19.39 | 1 | 91 | 4.63 | 134 | 8.06 | 1,965 | 99.49 |
| 9 | Christopher Bell | 6 | 6 | 1,393 | 70.53 | 3 | 688 | 34.84 | 2 | 281 | 14.23 | 1 | 68 | 3.44 | 119 | 7.16 | 1,975 | 100.00 |
| 10 | Kyle Busch | 6 | 4 | 732 | 37.06 | 1 | 213 | 10.78 | 1 | 157 | 7.95 | 0 | 66 | 3.34 | 61 | 3.67 | 1,975 | 100.00 |
| 11 | Chase Briscoe | 6 | 2 | 752 | 38.15 | 1 | 396 | 20.09 | 0 | 222 | 11.26 | 0 | 45 | 2.28 | 55 | 3.31 | 1,971 | 99.80 |
| 12 | Michael McDowell | 6 | 1 | 178 | 9.05 | 0 | 60 | 3.05 | 0 | 50 | 2.54 | 0 | 34 | 1.73 | 8 | 0.48 | 1,967 | 99.59 |
| 13 | Austin Cindric | 6 | 0 | 413 | 20.94 | 0 | 138 | 7.00 | 0 | 77 | 3.90 | 0 | 26 | 1.32 | 14 | 0.84 | 1,972 | 99.85 |
| 14 | Erik Jones | 6 | 1 | 248 | 13.69 | 0 | 91 | 5.02 | 0 | 32 | 1.77 | 0 | 18 | 0.99 | 12 | 0.72 | 1,812 | 91.75 |
| 15 | Alex Bowman | 6 | 2 | 595 | 35.67 | 0 | 246 | 14.75 | 0 | 30 | 1.80 | 0 | 9 | 0.54 | 42 | 2.53 | 1,668 | 84.46 |
| 16 | Ricky Stenhouse Jr | 6 | 0 | 69 | 3.54 | 0 | 37 | 1.90 | 0 | 15 | 0.77 | 0 | 6 | 0.31 | 27 | 1.62 | 1,947 | 98.58 |
| 17 | Brad Keselowski | 6 | 2 | 880 | 45.55 | 0 | 191 | 9.89 | 0 | 13 | 0.67 | 0 | 3 | 0.16 | 23 | 1.38 | 1,932 | 97.82 |
| 18 | Harrison Burton | 6 | 0 | 75 | 3.82 | 0 | 14 | 0.71 | 0 | 7 | 0.36 | 0 | 3 | 0.15 | 2 | 0.12 | 1,964 | 99.44 |
| 19 | AJ Allmendinger | 5 | 1 | 23 | 1.46 | 0 | 2 | 0.13 | 0 | 2 | 0.13 | 0 | 1 | 0.06 | 19 | 1.14 | 1,573 | 79.65 |
| 20 | Justin Haley | 6 | 0 | 9 | 0.46 | 0 | 5 | 0.25 | 0 | 2 | 0.10 | 0 | 1 | 0.05 | 2 | 0.12 | 1,969 | 99.70 |
| 21 | Bubba Wallace | 6 | 1 | 319 | 16.17 | 1 | 145 | 7.35 | 1 | 108 | 5.47 | 0 | 1 | 0.05 | 15 | 0.90 | 1,973 | 99.90 |
| 22 | Austin Dillon | 6 | 0 | 3 | 0.15 | 0 | 2 | 0.10 | 0 | 0 | 0.00 | 0 | 0 | 0.00 | 14 | 0.84 | 1,972 | 99.85 |
| 23 | Daniel Suarez | 6 | 1 | 232 | 11.76 | 0 | 14 | 0.71 | 0 | 5 | 0.25 | 0 | 0 | 0.00 | 19 | 1.14 | 1,972 | 99.85 |
| 24 | Tyler Reddick | 6 | 1 | 665 | 33.81 | 1 | 287 | 14.59 | 1 | 87 | 4.42 | 0 | 0 | 0.00 | 26 | 1.56 | 1,967 | 99.59 |
| 25 | Todd Gilliland | 6 | 0 | 20 | 1.02 | 0 | 7 | 0.36 | 0 | 4 | 0.20 | 0 | 0 | 0.00 | 1 | 0.06 | 1,965 | 99.49 |
| 26 | Aric Almirola | 6 | 2 | 721 | 36.94 | 1 | 213 | 10.91 | 0 | 84 | 4.30 | 0 | 0 | 0.00 | 39 | 2.35 | 1,952 | 98.84 |
| 27 | Chris Buescher | 5 | 1 | 361 | 20.90 | 1 | 165 | 9.55 | 1 | 139 | 8.05 | 0 | 0 | 0.00 | 71 | 4.27 | 1,727 | 87.44 |
| 28 | Ty Dillon | 6 | 0 | 12 | 0.72 | 0 | 0 | 0.00 | 0 | 0 | 0.00 | 0 | 0 | 0.00 | 9 | 0.54 | 1,672 | 84.66 |
| 29 | Corey LaJoie | 6 | 0 | 3 | 0.19 | 0 | 2 | 0.13 | 0 | 1 | 0.06 | 0 | 0 | 0.00 | 8 | 0.48 | 1,585 | 80.25 |
| 30 | JJ Yeley | 3 | 0 | 0 | 0.00 | 0 | 0 | 0.00 | 0 | 0 | 0.00 | 0 | 0 | 0.00 | 8 | 0.48 | 1,075 | 54.43 |
| 31 | Noah Gragson | 3 | 0 | 13 | 1.28 | 0 | 8 | 0.79 | 0 | 4 | 0.39 | 0 | 0 | 0.00 | 7 | 0.42 | 1,016 | 51.44 |
| 32 | BJ McLeod | 5 | 0 | 1 | 0.10 | 0 | 0 | 0.00 | 0 | 0 | 0.00 | 0 | 0 | 0.00 | 0 | 0.00 | 998 | 50.53 |
| 33 | Ty Gibbs | 3 | 1 | 131 | 14.62 | 0 | 7 | 0.78 | 0 | 6 | 0.67 | 0 | 0 | 0.00 | 8 | 0.48 | 896 | 45.37 |
| 34 | Ryan Preece | 2 | 0 | 62 | 8.65 | 0 | 2 | 0.28 | 0 | 1 | 0.14 | 0 | 0 | 0.00 | 0 | 0.00 | 717 | 36.30 |
| 35 | Carson Hocevar | 0 | 0 | 0 | 0.00 | 0 | 0 | 0.00 | 0 | 0 | 0.00 | 0 | 0 | 0.00 | 0 | 0.00 | 0 | 0.00 |
| 36 | Gray Gaulding | 0 | 0 | 0 | 0.00 | 0 | 0 | 0.00 | 0 | 0 | 0.00 | 0 | 0 | 0.00 | 0 | 0.00 | 0 | 0.00 |
| Driver | Races | T10 Fin | T10 Laps | T10% | T5 Fin | T5 Laps | T5% | T3 Fin | T3 Laps | T3% | Wins | Led | LL% | Fast Laps | FL% | Laps | Laps Run % |
Laps run inside the Top 10, 5, 3, and led as percentage of laps driver completed at 2022 Gateway, 2022 New Hampshire, 2022 Richmond 2, 2022 Phoenix
| wdt_ID | Driver | Races | T10 Fin | T10 Laps | T10% | T5 Fin | T5 Laps | T5% | T3 Fin | T3 Laps | T3% | Wins | Led | LL% | Fast Laps | FL% | Laps | Laps Run % |
|---|---|---|---|---|---|---|---|---|---|---|---|---|---|---|---|---|---|---|
| 1 | Joey Logano | 4 | 3 | 1,134 | 90.21 | 2 | 843 | 67.06 | 2 | 740 | 58.87 | 2 | 455 | 36.20 | 108 | 10.28 | 1,257 | 99.92 |
| 2 | Martin Truex Jr | 4 | 3 | 942 | 74.88 | 1 | 494 | 39.27 | 0 | 309 | 24.56 | 0 | 214 | 17.01 | 92 | 8.75 | 1,258 | 100.00 |
| 3 | Ryan Blaney | 4 | 3 | 871 | 69.29 | 2 | 606 | 48.21 | 1 | 402 | 31.98 | 0 | 122 | 9.71 | 107 | 10.18 | 1,257 | 99.92 |
| 4 | Ross Chastain | 4 | 3 | 605 | 48.17 | 1 | 224 | 17.83 | 1 | 112 | 8.92 | 0 | 79 | 6.29 | 52 | 4.95 | 1,256 | 99.84 |
| 5 | Kyle Busch | 4 | 3 | 568 | 45.15 | 1 | 180 | 14.31 | 1 | 154 | 12.24 | 0 | 65 | 5.17 | 53 | 5.04 | 1,258 | 100.00 |
| 6 | Kevin Harvick | 4 | 3 | 921 | 73.80 | 3 | 504 | 40.38 | 1 | 223 | 17.87 | 1 | 55 | 4.41 | 72 | 6.85 | 1,248 | 99.21 |
| 7 | Chase Briscoe | 4 | 1 | 546 | 43.54 | 1 | 395 | 31.50 | 0 | 222 | 17.70 | 0 | 45 | 3.59 | 46 | 4.38 | 1,254 | 99.68 |
| 8 | Christopher Bell | 4 | 4 | 730 | 58.03 | 2 | 242 | 19.24 | 2 | 107 | 8.51 | 1 | 42 | 3.34 | 85 | 8.09 | 1,258 | 100.00 |
| 9 | Michael McDowell | 4 | 0 | 112 | 8.96 | 0 | 36 | 2.88 | 0 | 35 | 2.80 | 0 | 34 | 2.72 | 5 | 0.48 | 1,250 | 99.36 |
| 10 | Austin Cindric | 4 | 0 | 379 | 30.15 | 0 | 138 | 10.98 | 0 | 77 | 6.13 | 0 | 26 | 2.07 | 13 | 1.24 | 1,257 | 99.92 |
| 11 | Denny Hamlin | 4 | 3 | 585 | 46.91 | 1 | 383 | 30.71 | 0 | 235 | 18.85 | 0 | 23 | 1.84 | 43 | 4.09 | 1,247 | 99.13 |
| 12 | Kyle Larson | 4 | 1 | 837 | 66.64 | 0 | 608 | 48.41 | 0 | 431 | 34.32 | 0 | 11 | 0.88 | 55 | 5.23 | 1,256 | 99.84 |
| 13 | Ricky Stenhouse Jr | 4 | 0 | 36 | 2.89 | 0 | 24 | 1.93 | 0 | 14 | 1.12 | 0 | 6 | 0.48 | 18 | 1.71 | 1,246 | 99.05 |
| 14 | Erik Jones | 4 | 1 | 219 | 19.96 | 0 | 67 | 6.11 | 0 | 12 | 1.09 | 0 | 4 | 0.36 | 0 | 0.00 | 1,097 | 87.20 |
| 15 | Harrison Burton | 4 | 0 | 75 | 5.98 | 0 | 14 | 1.12 | 0 | 7 | 0.56 | 0 | 3 | 0.24 | 1 | 0.10 | 1,254 | 99.68 |
| 16 | AJ Allmendinger | 3 | 1 | 23 | 2.68 | 0 | 2 | 0.23 | 0 | 2 | 0.23 | 0 | 1 | 0.12 | 17 | 1.62 | 857 | 68.12 |
| 17 | Alex Bowman | 4 | 0 | 127 | 13.35 | 0 | 11 | 1.16 | 0 | 2 | 0.21 | 0 | 1 | 0.11 | 32 | 3.04 | 951 | 75.60 |
| 18 | Brad Keselowski | 4 | 1 | 255 | 20.99 | 0 | 67 | 5.51 | 0 | 1 | 0.08 | 0 | 1 | 0.08 | 10 | 0.95 | 1,215 | 96.58 |
| 19 | Justin Haley | 4 | 0 | 9 | 0.72 | 0 | 5 | 0.40 | 0 | 2 | 0.16 | 0 | 1 | 0.08 | 2 | 0.19 | 1,254 | 99.68 |
| 20 | William Byron | 4 | 1 | 534 | 42.45 | 0 | 202 | 16.06 | 0 | 22 | 1.75 | 0 | 0 | 0.00 | 30 | 2.85 | 1,258 | 100.00 |
| 21 | Bubba Wallace | 4 | 1 | 289 | 23.01 | 1 | 140 | 11.15 | 1 | 105 | 8.36 | 0 | 0 | 0.00 | 13 | 1.24 | 1,256 | 99.84 |
| 22 | Austin Dillon | 4 | 0 | 0 | 0.00 | 0 | 0 | 0.00 | 0 | 0 | 0.00 | 0 | 0 | 0.00 | 14 | 1.33 | 1,256 | 99.84 |
| 23 | Daniel Suarez | 4 | 1 | 108 | 8.61 | 0 | 12 | 0.96 | 0 | 3 | 0.24 | 0 | 0 | 0.00 | 15 | 1.43 | 1,255 | 99.76 |
| 24 | Todd Gilliland | 4 | 0 | 4 | 0.32 | 0 | 1 | 0.08 | 0 | 0 | 0.00 | 0 | 0 | 0.00 | 1 | 0.10 | 1,251 | 99.44 |
| 25 | Tyler Reddick | 4 | 0 | 260 | 20.80 | 0 | 100 | 8.00 | 0 | 63 | 5.04 | 0 | 0 | 0.00 | 4 | 0.38 | 1,250 | 99.36 |
| 26 | Aric Almirola | 4 | 2 | 668 | 53.91 | 1 | 211 | 17.03 | 0 | 84 | 6.78 | 0 | 0 | 0.00 | 34 | 3.24 | 1,239 | 98.49 |
| 27 | Chris Buescher | 3 | 1 | 309 | 30.53 | 1 | 164 | 16.21 | 1 | 139 | 13.74 | 0 | 0 | 0.00 | 29 | 2.76 | 1,012 | 80.45 |
| 28 | Ty Dillon | 4 | 0 | 12 | 1.25 | 0 | 0 | 0.00 | 0 | 0 | 0.00 | 0 | 0 | 0.00 | 2 | 0.19 | 959 | 76.23 |
| 29 | BJ McLeod | 4 | 0 | 1 | 0.11 | 0 | 0 | 0.00 | 0 | 0 | 0.00 | 0 | 0 | 0.00 | 0 | 0.00 | 948 | 75.36 |
| 30 | Corey LaJoie | 4 | 0 | 3 | 0.35 | 0 | 2 | 0.23 | 0 | 1 | 0.12 | 0 | 0 | 0.00 | 5 | 0.48 | 869 | 69.08 |
| 31 | JJ Yeley | 2 | 0 | 0 | 0.00 | 0 | 0 | 0.00 | 0 | 0 | 0.00 | 0 | 0 | 0.00 | 7 | 0.67 | 692 | 55.01 |
| 32 | Noah Gragson | 1 | 0 | 13 | 3.27 | 0 | 8 | 2.02 | 0 | 4 | 1.01 | 0 | 0 | 0.00 | 6 | 0.57 | 397 | 31.56 |
| 33 | Ty Gibbs | 1 | 0 | 0 | 0.00 | 0 | 0 | 0.00 | 0 | 0 | 0.00 | 0 | 0 | 0.00 | 0 | 0.00 | 180 | 14.31 |
| 34 | Ryan Preece | 0 | 0 | 0 | 0.00 | 0 | 0 | 0.00 | 0 | 0 | 0.00 | 0 | 0 | 0.00 | 0 | 0.00 | 0 | 0.00 |
| 35 | Carson Hocevar | 0 | 0 | 0 | 0.00 | 0 | 0 | 0.00 | 0 | 0 | 0.00 | 0 | 0 | 0.00 | 0 | 0.00 | 0 | 0.00 |
| 36 | Gray Gaulding | 0 | 0 | 0 | 0.00 | 0 | 0 | 0.00 | 0 | 0 | 0.00 | 0 | 0 | 0.00 | 0 | 0.00 | 0 | 0.00 |
| Driver | Races | T10 Fin | T10 Laps | T10% | T5 Fin | T5 Laps | T5% | T3 Fin | T3 Laps | T3% | Wins | Led | LL% | Fast Laps | FL% | Laps | Laps Run % |
Laps run inside the Top 10, 5, 3, and led as percentage of laps driver completed at 2023 Phoenix 1 and 2023 Richmond 1
| wdt_ID | Driver | Races | T10 Fin | T10 Laps | T10% | T5 Fin | T5 Laps | T5% | T3 Fin | T3 Laps | T3% | Wins | Led | LL% | Fast Laps | FL% | Laps | Laps Run % |
|---|---|---|---|---|---|---|---|---|---|---|---|---|---|---|---|---|---|---|
| 1 | Kyle Larson | 2 | 2 | 714 | 99.58 | 2 | 596 | 83.12 | 1 | 547 | 76.29 | 1 | 294 | 41.00 | 87 | 14.24 | 717 | 100.00 |
| 2 | William Byron | 2 | 1 | 691 | 96.37 | 1 | 679 | 94.70 | 1 | 597 | 83.26 | 1 | 181 | 25.24 | 98 | 16.04 | 717 | 100.00 |
| 3 | Denny Hamlin | 2 | 0 | 562 | 78.38 | 0 | 266 | 37.10 | 0 | 188 | 26.22 | 0 | 71 | 9.90 | 32 | 5.24 | 717 | 100.00 |
| 4 | Martin Truex Jr | 2 | 0 | 297 | 41.42 | 0 | 190 | 26.50 | 0 | 142 | 19.80 | 0 | 56 | 7.81 | 21 | 3.44 | 717 | 100.00 |
| 5 | Kevin Harvick | 2 | 2 | 594 | 82.85 | 2 | 306 | 42.68 | 0 | 158 | 22.04 | 0 | 36 | 5.02 | 62 | 10.15 | 717 | 100.00 |
| 6 | Christopher Bell | 2 | 2 | 663 | 92.47 | 1 | 446 | 62.20 | 0 | 174 | 24.27 | 0 | 26 | 3.63 | 34 | 5.56 | 717 | 100.00 |
| 7 | Ross Chastain | 2 | 1 | 624 | 87.03 | 1 | 306 | 42.68 | 1 | 169 | 23.57 | 0 | 17 | 2.37 | 25 | 4.09 | 717 | 100.00 |
| 8 | Erik Jones | 2 | 0 | 29 | 4.06 | 0 | 24 | 3.36 | 0 | 20 | 2.80 | 0 | 14 | 1.96 | 12 | 1.96 | 715 | 99.72 |
| 9 | Alex Bowman | 2 | 2 | 468 | 65.27 | 0 | 235 | 32.78 | 0 | 28 | 3.91 | 0 | 8 | 1.12 | 10 | 1.64 | 717 | 100.00 |
| 10 | Brad Keselowski | 2 | 1 | 625 | 87.17 | 0 | 124 | 17.29 | 0 | 12 | 1.67 | 0 | 2 | 0.28 | 13 | 2.13 | 717 | 100.00 |
| 11 | Kyle Busch | 2 | 1 | 164 | 22.87 | 0 | 33 | 4.60 | 0 | 3 | 0.42 | 0 | 1 | 0.14 | 8 | 1.31 | 717 | 100.00 |
| 12 | Bubba Wallace | 2 | 0 | 30 | 4.18 | 0 | 5 | 0.70 | 0 | 3 | 0.42 | 0 | 1 | 0.14 | 2 | 0.33 | 717 | 100.00 |
| 13 | Joey Logano | 2 | 1 | 119 | 16.60 | 0 | 44 | 6.14 | 0 | 3 | 0.42 | 0 | 0 | 0.00 | 12 | 1.96 | 717 | 100.00 |
| 14 | Chase Briscoe | 2 | 1 | 206 | 28.73 | 0 | 1 | 0.14 | 0 | 0 | 0.00 | 0 | 0 | 0.00 | 9 | 1.47 | 717 | 100.00 |
| 15 | Michael McDowell | 2 | 1 | 66 | 9.21 | 0 | 24 | 3.35 | 0 | 15 | 2.09 | 0 | 0 | 0.00 | 3 | 0.49 | 717 | 100.00 |
| 16 | Daniel Suarez | 2 | 0 | 124 | 17.29 | 0 | 2 | 0.28 | 0 | 2 | 0.28 | 0 | 0 | 0.00 | 4 | 0.65 | 717 | 100.00 |
| 17 | Tyler Reddick | 2 | 1 | 405 | 56.49 | 1 | 187 | 26.08 | 1 | 24 | 3.35 | 0 | 0 | 0.00 | 22 | 3.60 | 717 | 100.00 |
| 18 | Ryan Preece | 2 | 0 | 62 | 8.65 | 0 | 2 | 0.28 | 0 | 1 | 0.14 | 0 | 0 | 0.00 | 0 | 0.00 | 717 | 100.00 |
| 19 | Ryan Blaney | 2 | 1 | 338 | 47.21 | 1 | 36 | 5.03 | 1 | 15 | 2.09 | 0 | 0 | 0.00 | 27 | 4.42 | 716 | 99.86 |
| 20 | AJ Allmendinger | 2 | 0 | 0 | 0.00 | 0 | 0 | 0.00 | 0 | 0 | 0.00 | 0 | 0 | 0.00 | 2 | 0.33 | 716 | 99.86 |
| 21 | Austin Dillon | 2 | 0 | 3 | 0.42 | 0 | 2 | 0.28 | 0 | 0 | 0.00 | 0 | 0 | 0.00 | 0 | 0.00 | 716 | 99.86 |
| 22 | Corey LaJoie | 2 | 0 | 0 | 0.00 | 0 | 0 | 0.00 | 0 | 0 | 0.00 | 0 | 0 | 0.00 | 3 | 0.49 | 716 | 99.86 |
| 23 | Ty Gibbs | 2 | 1 | 131 | 18.30 | 0 | 7 | 0.98 | 0 | 6 | 0.84 | 0 | 0 | 0.00 | 8 | 1.31 | 716 | 99.86 |
| 24 | Austin Cindric | 2 | 0 | 34 | 4.76 | 0 | 0 | 0.00 | 0 | 0 | 0.00 | 0 | 0 | 0.00 | 1 | 0.16 | 715 | 99.72 |
| 25 | Justin Haley | 2 | 0 | 0 | 0.00 | 0 | 0 | 0.00 | 0 | 0 | 0.00 | 0 | 0 | 0.00 | 0 | 0.00 | 715 | 99.72 |
| 26 | Chris Buescher | 2 | 0 | 52 | 7.27 | 0 | 1 | 0.14 | 0 | 0 | 0.00 | 0 | 0 | 0.00 | 42 | 6.87 | 715 | 99.72 |
| 27 | Todd Gilliland | 2 | 0 | 16 | 2.24 | 0 | 6 | 0.84 | 0 | 4 | 0.56 | 0 | 0 | 0.00 | 0 | 0.00 | 714 | 99.58 |
| 28 | Aric Almirola | 2 | 0 | 53 | 7.43 | 0 | 2 | 0.28 | 0 | 0 | 0.00 | 0 | 0 | 0.00 | 5 | 0.82 | 713 | 99.44 |
| 29 | Ty Dillon | 2 | 0 | 0 | 0.00 | 0 | 0 | 0.00 | 0 | 0 | 0.00 | 0 | 0 | 0.00 | 7 | 1.15 | 713 | 99.44 |
| 30 | Harrison Burton | 2 | 0 | 0 | 0.00 | 0 | 0 | 0.00 | 0 | 0 | 0.00 | 0 | 0 | 0.00 | 1 | 0.16 | 710 | 99.02 |
| 31 | Ricky Stenhouse Jr | 2 | 0 | 33 | 4.71 | 0 | 13 | 1.85 | 0 | 1 | 0.14 | 0 | 0 | 0.00 | 9 | 1.47 | 701 | 97.77 |
| 32 | Noah Gragson | 2 | 0 | 0 | 0.00 | 0 | 0 | 0.00 | 0 | 0 | 0.00 | 0 | 0 | 0.00 | 1 | 0.16 | 619 | 86.33 |
| 33 | JJ Yeley | 1 | 0 | 0 | 0.00 | 0 | 0 | 0.00 | 0 | 0 | 0.00 | 0 | 0 | 0.00 | 1 | 0.16 | 383 | 53.42 |
| 34 | BJ McLeod | 1 | 0 | 0 | 0.00 | 0 | 0 | 0.00 | 0 | 0 | 0.00 | 0 | 0 | 0.00 | 0 | 0.00 | 50 | 6.97 |
| 35 | Carson Hocevar | 0 | 0 | 0 | 0.00 | 0 | 0 | 0.00 | 0 | 0 | 0.00 | 0 | 0 | 0.00 | 0 | 0.00 | 0 | 0.00 |
| 36 | Gray Gaulding | 0 | 0 | 0 | 0.00 | 0 | 0 | 0.00 | 0 | 0 | 0.00 | 0 | 0 | 0.00 | 0 | 0.00 | 0 | 0.00 |
| Driver | Races | T10 Fin | T10 Laps | T10% | T5 Fin | T5 Laps | T5% | T3 Fin | T3 Laps | T3% | Wins | Led | LL% | Fast Laps | FL% | Laps | Laps Run % |
Thanks for checking out the Front Runners! Let’s WIN THE RACE!