
Crayon 301 at New Hampshire Motor Speedway
Front Runners highlights the drivers that lead laps, run fast laps, and run inside the top 10, 5, & 3 the most at correlated track types.
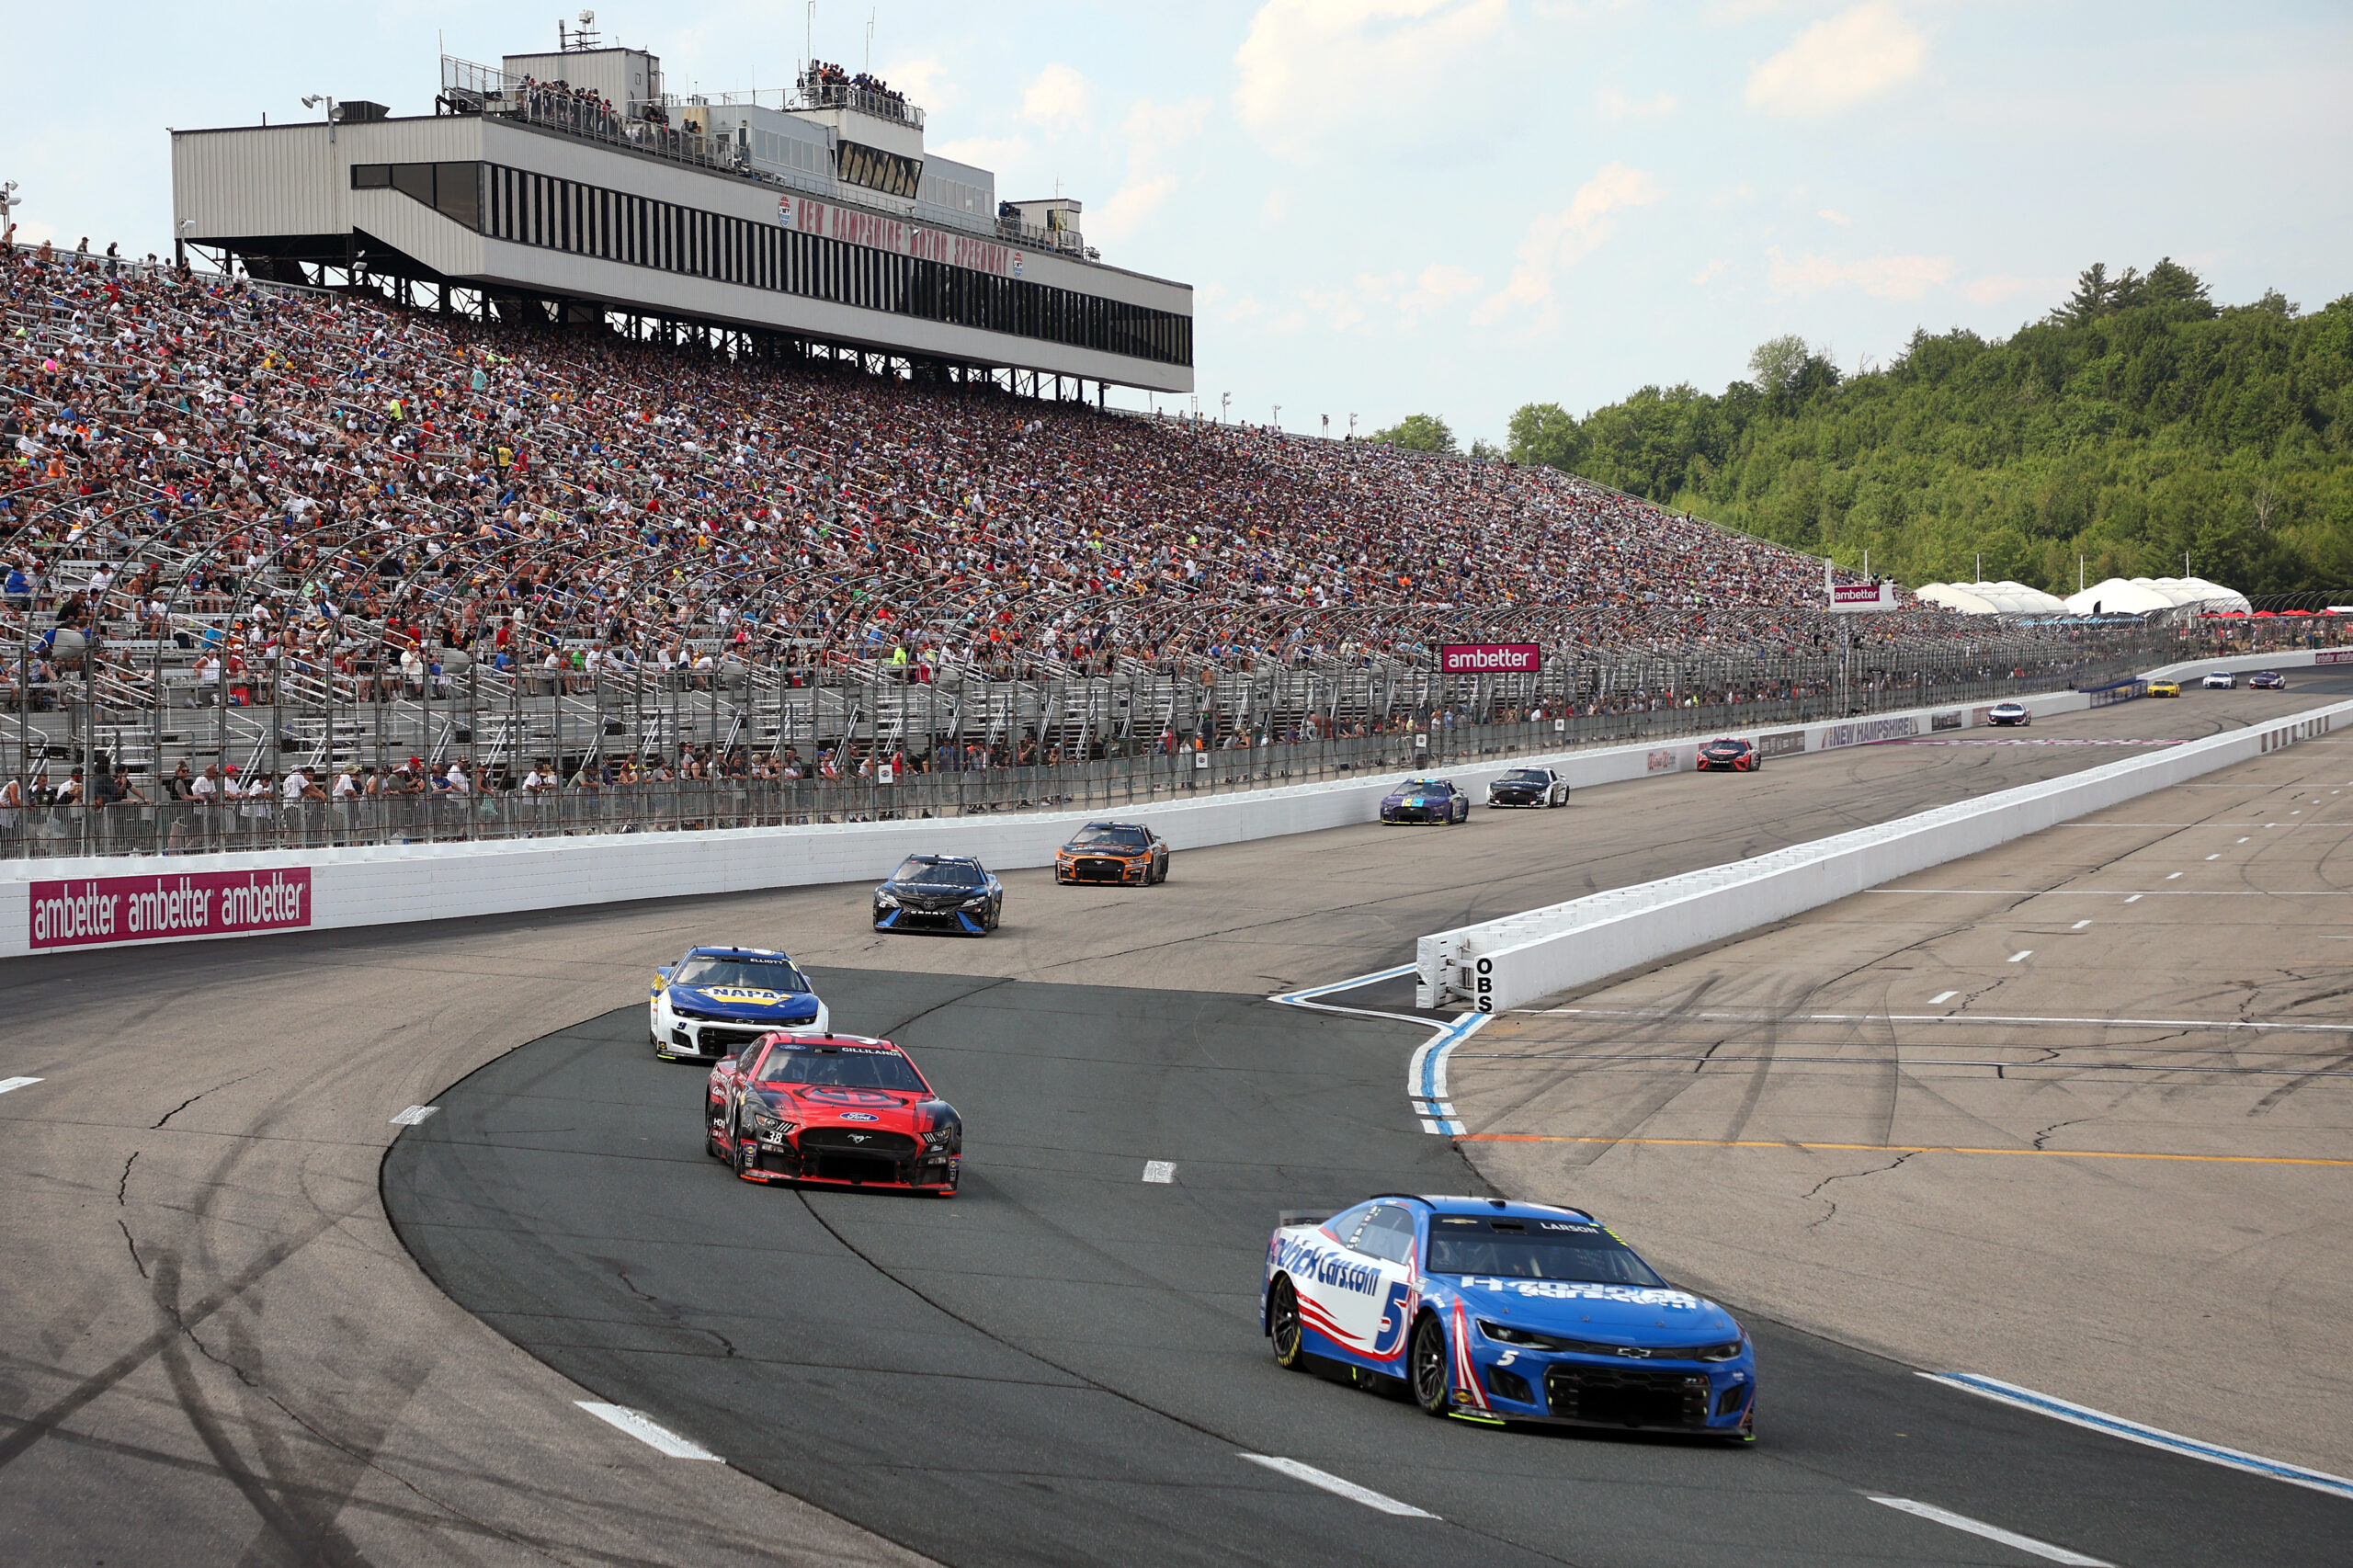
The NASCAR Cup Series will visit make its lone visit of 2023 to New England on Sunday. New Hampshire Motor Speedway is a 1-mile true oval with minimal banking. The straight aways are banked at just 1 degree and the turns are progressively banked from 2-7 degrees.
This week I am focusing on two data sets. First, the largest dataset includes all seven races that the Cup Series has completed at Phoenix, Richmond, and New Hampshire in the Gen 7 car. The second data set is just the two races this year at Phoenix and Richmond. Given the low correlation between New Hampshire and Gateway over the past two years I was unlikely to use Gateway, but the fact that NASCAR is using a different areo-package at New Hampshire than it did at Gateway seals the deal for me to exclude Gateway from the dataset.
The charts below are sorted by percentage of laps led by default. There are also a few more columns that you can choose to display but for ease of display those columns are hidden by default.
Laps run inside the Top 10, 5, 3, and led as percentage laps driver completed at Phoenix 1 (2023) and Richmond 1 (2023)
| wdt_ID | Driver | Races | T10 Fin | T10 Laps | T10% | T5 Fin | T5 Laps | T5% | T3 Fin | T3 Laps | T3% | Wins | Led | LL% | Fast Laps | FL% | Laps | Laps Run % |
|---|---|---|---|---|---|---|---|---|---|---|---|---|---|---|---|---|---|---|
| 1 | Kyle Larson | 2 | 2 | 714 | 99.58 | 2 | 596 | 83.12 | 1 | 547 | 76.29 | 1 | 294 | 41.00 | 87 | 14.24 | 717 | 100.00 |
| 2 | William Byron | 2 | 1 | 691 | 96.37 | 1 | 679 | 94.70 | 1 | 597 | 83.26 | 1 | 181 | 25.24 | 98 | 16.04 | 717 | 100.00 |
| 3 | Denny Hamlin | 2 | 0 | 562 | 78.38 | 0 | 266 | 37.10 | 0 | 188 | 26.22 | 0 | 71 | 9.90 | 32 | 5.24 | 717 | 100.00 |
| 4 | Martin Truex Jr | 2 | 0 | 297 | 41.42 | 0 | 190 | 26.50 | 0 | 142 | 19.80 | 0 | 56 | 7.81 | 21 | 3.44 | 717 | 100.00 |
| 5 | Kevin Harvick | 2 | 2 | 594 | 82.85 | 2 | 306 | 42.68 | 0 | 158 | 22.04 | 0 | 36 | 5.02 | 62 | 10.15 | 717 | 100.00 |
| 6 | Christopher Bell | 2 | 2 | 663 | 92.47 | 1 | 446 | 62.20 | 0 | 174 | 24.27 | 0 | 26 | 3.63 | 34 | 5.56 | 717 | 100.00 |
| 7 | Ross Chastain | 2 | 1 | 624 | 87.03 | 1 | 306 | 42.68 | 1 | 169 | 23.57 | 0 | 17 | 2.37 | 25 | 4.09 | 717 | 100.00 |
| 8 | Erik Jones | 2 | 0 | 29 | 4.06 | 0 | 24 | 3.36 | 0 | 20 | 2.80 | 0 | 14 | 1.96 | 12 | 1.96 | 715 | 99.72 |
| 9 | Alex Bowman | 2 | 2 | 468 | 65.27 | 0 | 235 | 32.78 | 0 | 28 | 3.91 | 0 | 8 | 1.12 | 10 | 1.64 | 717 | 100.00 |
| 10 | Brad Keselowski | 2 | 1 | 625 | 87.17 | 0 | 124 | 17.29 | 0 | 12 | 1.67 | 0 | 2 | 0.28 | 13 | 2.13 | 717 | 100.00 |
| 11 | Kyle Busch | 2 | 1 | 164 | 22.87 | 0 | 33 | 4.60 | 0 | 3 | 0.42 | 0 | 1 | 0.14 | 8 | 1.31 | 717 | 100.00 |
| 12 | Bubba Wallace | 2 | 0 | 30 | 4.18 | 0 | 5 | 0.70 | 0 | 3 | 0.42 | 0 | 1 | 0.14 | 2 | 0.33 | 717 | 100.00 |
| 13 | Tyler Reddick | 2 | 1 | 405 | 56.49 | 1 | 187 | 26.08 | 1 | 24 | 3.35 | 0 | 0 | 0.00 | 22 | 3.60 | 717 | 100.00 |
| 14 | Ryan Blaney | 2 | 1 | 338 | 47.21 | 1 | 36 | 5.03 | 1 | 15 | 2.09 | 0 | 0 | 0.00 | 27 | 4.42 | 716 | 99.86 |
| 15 | Chase Briscoe | 2 | 1 | 206 | 28.73 | 0 | 1 | 0.14 | 0 | 0 | 0.00 | 0 | 0 | 0.00 | 9 | 1.47 | 717 | 100.00 |
| 16 | Ty Gibbs | 2 | 1 | 131 | 18.30 | 0 | 7 | 0.98 | 0 | 6 | 0.84 | 0 | 0 | 0.00 | 8 | 1.31 | 716 | 99.86 |
| 17 | Daniel Suarez | 2 | 0 | 124 | 17.29 | 0 | 2 | 0.28 | 0 | 2 | 0.28 | 0 | 0 | 0.00 | 4 | 0.65 | 717 | 100.00 |
| 18 | Joey Logano | 2 | 1 | 119 | 16.60 | 0 | 44 | 6.14 | 0 | 3 | 0.42 | 0 | 0 | 0.00 | 12 | 1.96 | 717 | 100.00 |
| 19 | Michael McDowell | 2 | 1 | 66 | 9.21 | 0 | 24 | 3.35 | 0 | 15 | 2.09 | 0 | 0 | 0.00 | 3 | 0.49 | 717 | 100.00 |
| 20 | Ryan Preece | 2 | 0 | 62 | 8.65 | 0 | 2 | 0.28 | 0 | 1 | 0.14 | 0 | 0 | 0.00 | 0 | 0.00 | 717 | 100.00 |
| 21 | Aric Almirola | 2 | 0 | 53 | 7.43 | 0 | 2 | 0.28 | 0 | 0 | 0.00 | 0 | 0 | 0.00 | 5 | 0.82 | 713 | 99.44 |
| 22 | Chris Buescher | 2 | 0 | 52 | 7.27 | 0 | 1 | 0.14 | 0 | 0 | 0.00 | 0 | 0 | 0.00 | 42 | 6.87 | 715 | 99.72 |
| 23 | Austin Cindric | 2 | 0 | 34 | 4.76 | 0 | 0 | 0.00 | 0 | 0 | 0.00 | 0 | 0 | 0.00 | 1 | 0.16 | 715 | 99.72 |
| 24 | Ricky Stenhouse Jr | 2 | 0 | 33 | 4.71 | 0 | 13 | 1.85 | 0 | 1 | 0.14 | 0 | 0 | 0.00 | 9 | 1.47 | 701 | 97.77 |
| 25 | Todd Gilliland | 2 | 0 | 16 | 2.24 | 0 | 6 | 0.84 | 0 | 4 | 0.56 | 0 | 0 | 0.00 | 0 | 0.00 | 714 | 99.58 |
| 26 | Austin Dillon | 2 | 0 | 3 | 0.42 | 0 | 2 | 0.28 | 0 | 0 | 0.00 | 0 | 0 | 0.00 | 0 | 0.00 | 716 | 99.86 |
| 27 | Ty Dillon | 2 | 0 | 0 | 0.00 | 0 | 0 | 0.00 | 0 | 0 | 0.00 | 0 | 0 | 0.00 | 7 | 1.15 | 713 | 99.44 |
| 28 | Corey LaJoie | 2 | 0 | 0 | 0.00 | 0 | 0 | 0.00 | 0 | 0 | 0.00 | 0 | 0 | 0.00 | 3 | 0.49 | 716 | 99.86 |
| 29 | AJ Allmendinger | 2 | 0 | 0 | 0.00 | 0 | 0 | 0.00 | 0 | 0 | 0.00 | 0 | 0 | 0.00 | 2 | 0.33 | 716 | 99.86 |
| 30 | Harrison Burton | 2 | 0 | 0 | 0.00 | 0 | 0 | 0.00 | 0 | 0 | 0.00 | 0 | 0 | 0.00 | 1 | 0.16 | 710 | 99.02 |
| 31 | Noah Gragson | 2 | 0 | 0 | 0.00 | 0 | 0 | 0.00 | 0 | 0 | 0.00 | 0 | 0 | 0.00 | 1 | 0.16 | 619 | 86.33 |
| 32 | Justin Haley | 2 | 0 | 0 | 0.00 | 0 | 0 | 0.00 | 0 | 0 | 0.00 | 0 | 0 | 0.00 | 0 | 0.00 | 715 | 99.72 |
| 33 | BJ McLeod | 1 | 0 | 0 | 0.00 | 0 | 0 | 0.00 | 0 | 0 | 0.00 | 0 | 0 | 0.00 | 0 | 0.00 | 50 | 6.97 |
| 34 | Chase Elliott | 0 | 0 | 0 | 0.00 | 0 | 0 | 0.00 | 0 | 0 | 0.00 | 0 | 0 | 0.00 | 0 | 0.00 | 0 | 0.00 |
| 35 | Ryan Newman | 0 | 0 | 0 | 0.00 | 0 | 0 | 0.00 | 0 | 0 | 0.00 | 0 | 0 | 0.00 | 0 | 0.00 | 0 | 0.00 |
| 36 | Cole Custer | 0 | 0 | 0 | 0.00 | 0 | 0 | 0.00 | 0 | 0 | 0.00 | 0 | 0 | 0.00 | 0 | 0.00 | 0 | 0.00 |
| Driver | Races | T10 Fin | T10 Laps | T10% | T5 Fin | T5 Laps | T5% | T3 Fin | T3 Laps | T3% | Wins | Led | LL% | Fast Laps | FL% | Laps | Laps Run % |
Note – Chase Elliott missed both 2023 short flat track races being displayed here with an injury.
Laps run inside the Top 10, 5, 3, and led as percentage laps driver completed at Phoenix (3), Richmond (3) and New Hampshire (1) in 2022 and 2023
| wdt_ID | Driver | Races | T10 Fin | T10 Laps | T10% | T5 Fin | T5 Laps | T5% | T3 Fin | T3 Laps | T3% | Wins | Led | LL% | Fast Laps | FL% | Laps | Laps Run % |
|---|---|---|---|---|---|---|---|---|---|---|---|---|---|---|---|---|---|---|
| 1 | Joey Logano | 7 | 4 | 1,618 | 66.31 | 1 | 902 | 36.97 | 1 | 703 | 28.81 | 1 | 437 | 17.91 | 109 | 5.22 | 2,440 | 99.92 |
| 2 | Ryan Blaney | 7 | 5 | 1,676 | 68.69 | 3 | 1,039 | 42.58 | 2 | 658 | 26.97 | 0 | 384 | 15.74 | 171 | 8.19 | 2,440 | 99.92 |
| 3 | Martin Truex Jr | 7 | 3 | 1,504 | 64.03 | 2 | 941 | 40.06 | 0 | 611 | 26.01 | 0 | 308 | 13.11 | 131 | 6.27 | 2,349 | 96.19 |
| 4 | Kyle Larson | 7 | 4 | 1,900 | 80.27 | 3 | 1,353 | 57.16 | 1 | 1,016 | 42.92 | 1 | 306 | 12.93 | 166 | 7.95 | 2,367 | 96.93 |
| 5 | William Byron | 7 | 3 | 1,759 | 72.03 | 2 | 1,272 | 52.09 | 2 | 922 | 37.76 | 1 | 315 | 12.90 | 178 | 8.52 | 2,442 | 100.00 |
| 6 | Christopher Bell | 7 | 6 | 1,642 | 67.30 | 3 | 833 | 34.14 | 2 | 437 | 17.91 | 1 | 131 | 5.37 | 131 | 6.27 | 2,440 | 99.92 |
| 7 | Chase Briscoe | 7 | 3 | 1,091 | 44.75 | 2 | 563 | 23.09 | 1 | 318 | 13.04 | 1 | 118 | 4.84 | 91 | 4.36 | 2,438 | 99.84 |
| 8 | Denny Hamlin | 7 | 4 | 1,364 | 55.86 | 2 | 790 | 32.35 | 1 | 582 | 23.83 | 1 | 99 | 4.05 | 89 | 4.26 | 2,442 | 100.00 |
| 9 | Ross Chastain | 7 | 4 | 1,592 | 65.27 | 3 | 732 | 30.01 | 3 | 401 | 16.44 | 0 | 96 | 3.94 | 86 | 4.12 | 2,439 | 99.88 |
| 10 | Kevin Harvick | 7 | 7 | 2,084 | 85.34 | 6 | 1,095 | 44.84 | 2 | 545 | 22.32 | 1 | 91 | 3.73 | 165 | 7.90 | 2,442 | 100.00 |
| 11 | Chase Elliott | 5 | 2 | 1,253 | 72.72 | 2 | 672 | 39.00 | 1 | 401 | 23.27 | 0 | 64 | 3.71 | 93 | 4.45 | 1,723 | 70.56 |
| 12 | Erik Jones | 7 | 0 | 169 | 7.43 | 0 | 59 | 2.59 | 0 | 40 | 1.76 | 0 | 14 | 0.62 | 21 | 1.01 | 2,276 | 93.20 |
| 13 | Alex Bowman | 7 | 3 | 804 | 37.66 | 0 | 254 | 11.90 | 0 | 32 | 1.50 | 0 | 9 | 0.42 | 63 | 3.02 | 2,135 | 87.43 |
| 14 | Cole Custer | 5 | 0 | 208 | 12.10 | 0 | 66 | 3.84 | 0 | 22 | 1.28 | 0 | 5 | 0.29 | 19 | 0.91 | 1,719 | 70.39 |
| 15 | Ricky Stenhouse Jr | 7 | 0 | 62 | 2.57 | 0 | 36 | 1.49 | 0 | 15 | 0.62 | 0 | 6 | 0.25 | 31 | 1.48 | 2,412 | 98.77 |
| 16 | Harrison Burton | 7 | 0 | 74 | 3.05 | 0 | 18 | 0.74 | 0 | 7 | 0.29 | 0 | 3 | 0.12 | 7 | 0.34 | 2,427 | 99.39 |
| 17 | Brad Keselowski | 7 | 2 | 1,009 | 42.08 | 0 | 191 | 7.96 | 0 | 13 | 0.54 | 0 | 2 | 0.08 | 33 | 1.58 | 2,398 | 98.20 |
| 18 | Kyle Busch | 7 | 5 | 947 | 38.78 | 0 | 309 | 12.65 | 0 | 110 | 4.50 | 0 | 2 | 0.08 | 41 | 1.96 | 2,442 | 100.00 |
| 19 | AJ Allmendinger | 6 | 0 | 9 | 0.44 | 0 | 2 | 0.10 | 0 | 2 | 0.10 | 0 | 1 | 0.05 | 22 | 1.05 | 2,036 | 83.37 |
| 20 | Justin Haley | 7 | 0 | 2 | 0.08 | 0 | 1 | 0.04 | 0 | 1 | 0.04 | 0 | 1 | 0.04 | 12 | 0.57 | 2,432 | 99.59 |
| 21 | Bubba Wallace | 7 | 1 | 319 | 13.10 | 1 | 145 | 5.95 | 1 | 108 | 4.43 | 0 | 1 | 0.04 | 23 | 1.10 | 2,436 | 99.75 |
| 22 | Austin Cindric | 7 | 0 | 264 | 10.83 | 0 | 45 | 1.85 | 0 | 10 | 0.41 | 0 | 1 | 0.04 | 15 | 0.72 | 2,437 | 99.80 |
| 23 | Tyler Reddick | 7 | 2 | 870 | 35.74 | 2 | 316 | 12.98 | 2 | 79 | 3.25 | 0 | 0 | 0.00 | 48 | 2.30 | 2,434 | 99.67 |
| 24 | Aric Almirola | 7 | 1 | 562 | 23.25 | 0 | 104 | 4.30 | 0 | 0 | 0.00 | 0 | 0 | 0.00 | 49 | 2.35 | 2,417 | 98.98 |
| 25 | Chris Buescher | 7 | 2 | 414 | 16.97 | 1 | 165 | 6.77 | 1 | 139 | 5.70 | 0 | 0 | 0.00 | 88 | 4.21 | 2,439 | 99.88 |
| 26 | Ty Gibbs | 3 | 1 | 131 | 14.62 | 0 | 7 | 0.78 | 0 | 6 | 0.67 | 0 | 0 | 0.00 | 8 | 0.38 | 896 | 36.69 |
| 27 | Austin Dillon | 7 | 1 | 321 | 13.17 | 0 | 27 | 1.11 | 0 | 6 | 0.25 | 0 | 0 | 0.00 | 26 | 1.25 | 2,438 | 99.84 |
| 28 | Daniel Suarez | 7 | 2 | 237 | 9.72 | 0 | 30 | 1.23 | 0 | 15 | 0.62 | 0 | 0 | 0.00 | 19 | 0.91 | 2,439 | 99.88 |
| 29 | Ryan Preece | 2 | 0 | 62 | 8.65 | 0 | 2 | 0.28 | 0 | 1 | 0.14 | 0 | 0 | 0.00 | 0 | 0.00 | 717 | 29.36 |
| 30 | Michael McDowell | 7 | 1 | 66 | 2.72 | 0 | 24 | 0.99 | 0 | 15 | 0.62 | 0 | 0 | 0.00 | 39 | 1.87 | 2,427 | 99.39 |
| 31 | Noah Gragson | 3 | 0 | 13 | 1.28 | 0 | 8 | 0.79 | 0 | 4 | 0.39 | 0 | 0 | 0.00 | 7 | 0.34 | 1,016 | 41.61 |
| 32 | Todd Gilliland | 7 | 0 | 28 | 1.15 | 0 | 7 | 0.29 | 0 | 4 | 0.16 | 0 | 0 | 0.00 | 2 | 0.10 | 2,429 | 99.47 |
| 33 | Ty Dillon | 7 | 0 | 9 | 0.42 | 0 | 0 | 0.00 | 0 | 0 | 0.00 | 0 | 0 | 0.00 | 9 | 0.43 | 2,137 | 87.51 |
| 34 | Corey LaJoie | 7 | 0 | 3 | 0.15 | 0 | 2 | 0.10 | 0 | 1 | 0.05 | 0 | 0 | 0.00 | 9 | 0.43 | 1,950 | 79.85 |
| 35 | BJ McLeod | 6 | 0 | 0 | 0.00 | 0 | 0 | 0.00 | 0 | 0 | 0.00 | 0 | 0 | 0.00 | 0 | 0.00 | 1,443 | 59.09 |
| 36 | Ryan Newman | 0 | 0 | 0 | 0.00 | 0 | 0 | 0.00 | 0 | 0 | 0.00 | 0 | 0 | 0.00 | 0 | 0.00 | 0 | 0.00 |
| Driver | Races | T10 Fin | T10 Laps | T10% | T5 Fin | T5 Laps | T5% | T3 Fin | T3 Laps | T3% | Wins | Led | LL% | Fast Laps | FL% | Laps | Laps Run % |
Thanks for checking out the Front Runners! Let’s WIN THE RACE!