
Quaker State 400 at Atlanta Motor Speedway
Front Runners highlights the drivers that lead laps, run fast laps, and run inside the top 10, 5, & 3 the most at correlated track types.
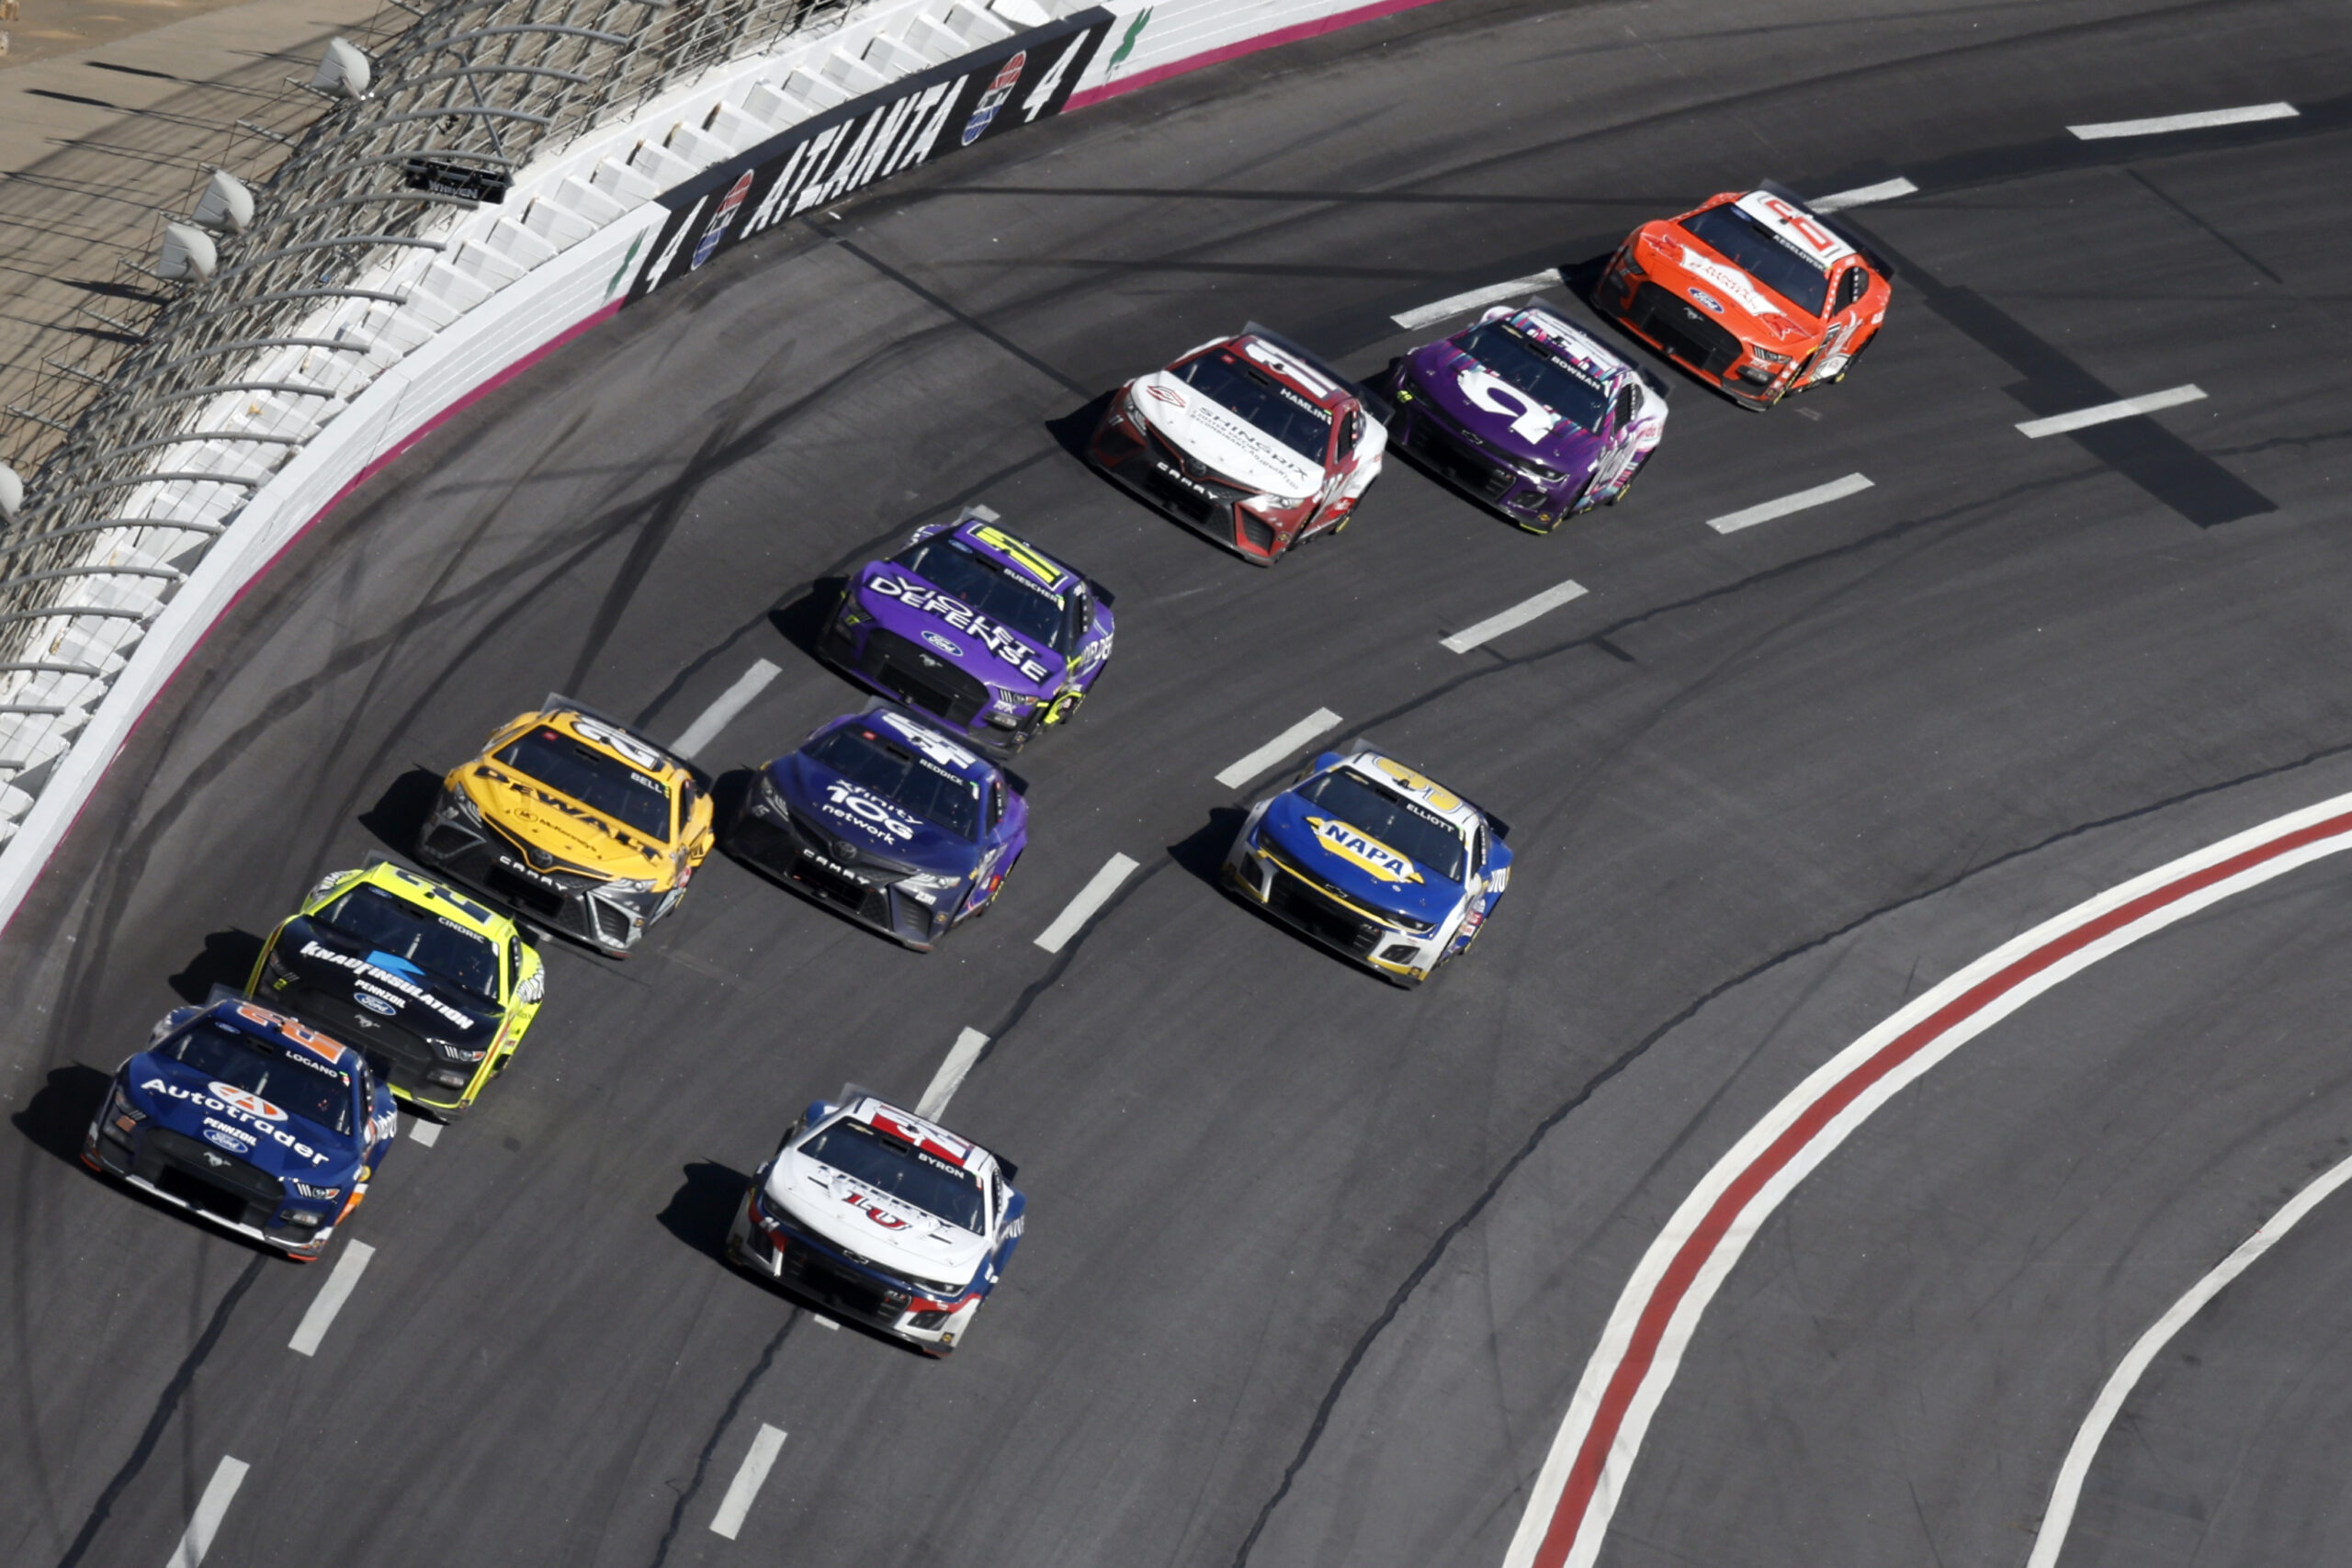
The NASCAR Cup Series makes its first return visit of 2023 when drivers will take 267 laps around the 1.5-mile quad-oval at Atlanta Motor Speedway. Although Atlanta is an intermediate sized track, the reconfiguration following the 2021 season has made Atlanta into a mini-superspeedway. Atlanta is now banked up to 28 degrees in the turns. Like at Daytona and Talladega, success at Atlanta requires drivers to successfully navigate and stay in the draft.
This week I am focusing on three data sets. First, the largest dataset includes all nine races that the Cup Series has completed at Atlanta, Daytona, and Talladega in the Gen 7 car. The second data set is just the three races at Atlanta Motor Speedway in the Gen 7 car. The final data set is the three drafting races so far in 2023.
The chart below is sorted by percentage of laps led by default. There was a data corruption in a few races that eliminated finishing position and fastest laps from about half the races I am considering this week. Since that data was corrupted I have removed the columns of number of finishes and fastest laps from this weeks chart. I’m hoping to get it restored before the next drafting race at Daytona in August. The good news is that at drafting tracks, finishing position can often get misleading and fastest laps are largely random. So if there is any race where missing these stats has the least impact, its this one.
Laps run inside the Top 10, 5, 3, and led as percentage laps driver completed at Atlanta (3), Daytona (3), and Talladega (3)
| wdt_ID | Driver | Races | T10 Laps | T10% | T5 Laps | T5% | T3 Laps | T3% | Led | LL% | Laps | Laps Run % |
|---|---|---|---|---|---|---|---|---|---|---|---|---|
| 1 | William Byron | 9 | 878 | 54.06 | 570 | 35.10 | 400 | 24.63 | 192 | 11.82 | 1,624 | 81.98 |
| 2 | Chase Elliott | 8 | 977 | 60.99 | 514 | 32.08 | 363 | 22.66 | 183 | 11.42 | 1,602 | 80.87 |
| 3 | Joey Logano | 9 | 796 | 42.61 | 514 | 27.52 | 371 | 19.86 | 184 | 9.85 | 1,868 | 94.30 |
| 4 | Ryan Blaney | 9 | 1,142 | 57.85 | 811 | 41.08 | 606 | 30.70 | 161 | 8.16 | 1,974 | 99.65 |
| 5 | Brad Keselowski | 9 | 751 | 40.59 | 465 | 25.14 | 269 | 14.54 | 149 | 8.05 | 1,850 | 93.39 |
| 6 | Ross Chastain | 9 | 751 | 41.91 | 454 | 25.33 | 263 | 14.68 | 125 | 6.98 | 1,792 | 90.46 |
| 7 | Erik Jones | 9 | 822 | 44.08 | 415 | 22.25 | 204 | 10.94 | 85 | 4.56 | 1,865 | 94.14 |
| 8 | Aric Almirola | 9 | 729 | 38.25 | 441 | 23.14 | 239 | 12.54 | 86 | 4.51 | 1,906 | 96.21 |
| 9 | Kyle Busch | 9 | 758 | 41.53 | 372 | 20.38 | 238 | 13.04 | 78 | 4.27 | 1,825 | 92.13 |
| 10 | Denny Hamlin | 9 | 1,050 | 61.22 | 482 | 28.10 | 231 | 13.47 | 73 | 4.26 | 1,715 | 86.57 |
| 11 | Martin Truex Jr | 9 | 858 | 43.31 | 400 | 20.19 | 244 | 12.32 | 79 | 3.99 | 1,981 | 100.00 |
| 12 | Bubba Wallace | 9 | 592 | 30.02 | 392 | 19.88 | 265 | 13.44 | 70 | 3.55 | 1,972 | 99.55 |
| 13 | Ricky Stenhouse Jr | 9 | 474 | 28.99 | 219 | 13.39 | 137 | 8.38 | 54 | 3.30 | 1,635 | 82.53 |
| 14 | Kyle Larson | 9 | 686 | 41.55 | 341 | 20.65 | 212 | 12.84 | 49 | 2.97 | 1,651 | 83.34 |
| 15 | Daniel Suarez | 9 | 603 | 33.24 | 210 | 11.58 | 123 | 6.78 | 52 | 2.87 | 1,814 | 91.57 |
| 16 | Tyler Reddick | 9 | 547 | 36.25 | 326 | 21.60 | 218 | 14.45 | 43 | 2.85 | 1,509 | 76.17 |
| 17 | Christopher Bell | 9 | 907 | 50.36 | 401 | 22.27 | 229 | 12.72 | 50 | 2.78 | 1,801 | 90.91 |
| 18 | Chris Buescher | 9 | 588 | 36.75 | 282 | 17.63 | 165 | 10.31 | 39 | 2.44 | 1,600 | 80.77 |
| 19 | Austin Cindric | 9 | 787 | 42.47 | 385 | 20.78 | 256 | 13.82 | 45 | 2.43 | 1,853 | 93.54 |
| 20 | Harrison Burton | 9 | 283 | 19.12 | 117 | 7.91 | 79 | 5.34 | 33 | 2.23 | 1,480 | 74.71 |
| 21 | Alex Bowman | 8 | 572 | 33.99 | 210 | 12.48 | 127 | 7.55 | 31 | 1.84 | 1,683 | 84.96 |
| 22 | Corey LaJoie | 9 | 318 | 17.53 | 119 | 6.56 | 91 | 5.02 | 27 | 1.49 | 1,814 | 91.57 |
| 23 | Kevin Harvick | 9 | 689 | 36.69 | 381 | 20.29 | 165 | 8.79 | 24 | 1.28 | 1,878 | 94.80 |
| 24 | Ryan Preece | 3 | 159 | 25.90 | 89 | 14.50 | 52 | 8.47 | 6 | 0.98 | 614 | 30.99 |
| 25 | Austin Dillon | 9 | 187 | 12.31 | 60 | 3.95 | 36 | 2.37 | 13 | 0.86 | 1,519 | 76.68 |
| 26 | Chase Briscoe | 9 | 361 | 20.27 | 122 | 6.85 | 69 | 3.87 | 12 | 0.67 | 1,781 | 89.90 |
| 27 | Ty Gibbs | 5 | 143 | 16.92 | 69 | 8.17 | 42 | 4.97 | 4 | 0.47 | 845 | 42.66 |
| 28 | Justin Haley | 9 | 394 | 20.26 | 101 | 5.19 | 34 | 1.75 | 9 | 0.46 | 1,945 | 98.18 |
| 29 | BJ McLeod | 9 | 43 | 2.54 | 15 | 0.89 | 11 | 0.65 | 7 | 0.41 | 1,692 | 85.41 |
| 30 | Cole Custer | 6 | 170 | 16.39 | 36 | 3.47 | 6 | 0.58 | 3 | 0.29 | 1,037 | 52.35 |
| 31 | AJ Allmendinger | 3 | 72 | 10.79 | 14 | 2.10 | 3 | 0.45 | 1 | 0.15 | 667 | 33.67 |
| 32 | Michael McDowell | 9 | 362 | 18.99 | 118 | 6.19 | 19 | 1.00 | 2 | 0.10 | 1,906 | 96.21 |
| 33 | Noah Gragson | 8 | 178 | 13.69 | 68 | 5.23 | 41 | 3.15 | 1 | 0.08 | 1,300 | 65.62 |
| 34 | Ty Dillon | 9 | 122 | 8.91 | 21 | 1.53 | 8 | 0.58 | 1 | 0.07 | 1,370 | 69.16 |
| 35 | Todd Gilliland | 9 | 368 | 19.91 | 128 | 6.93 | 47 | 2.54 | 1 | 0.05 | 1,848 | 93.29 |
| 36 | JJ Yeley | 3 | 11 | 1.72 | 5 | 0.78 | 2 | 0.31 | 0 | 0.00 | 638 | 32.21 |
| 37 | Austin Hill | 1 | 2 | 1.02 | 1 | 0.51 | 1 | 0.51 | 0 | 0.00 | 196 | 9.89 |
| Driver | Races | T10 Laps | T10% | T5 Laps | T5% | T3 Laps | T3% | Led | LL% | Laps | Laps Run % |
Laps run inside the Top 10, 5, 3, and led as percentage laps driver completed at Atlanta in 2022 and 2023
| wdt_ID | Driver | Races | T10 Fin | T10 Laps | T10% | T5 Fin | T5 Laps | T5% | T3 Fin | T3 Laps | T3% | Wins | Led | LL% | Fast Laps | FL% | Laps | Laps Run % |
|---|---|---|---|---|---|---|---|---|---|---|---|---|---|---|---|---|---|---|
| 1 | William Byron | 3 | 1 | 513 | 74.67 | 1 | 342 | 49.78 | 1 | 255 | 37.12 | 1 | 151 | 21.98 | 15 | 2.30 | 687 | 81.30 |
| 2 | Chase Elliott | 2 | 2 | 485 | 82.91 | 1 | 282 | 48.21 | 1 | 202 | 34.53 | 1 | 124 | 21.20 | 11 | 1.69 | 585 | 69.23 |
| 3 | Joey Logano | 3 | 2 | 408 | 48.75 | 1 | 272 | 32.50 | 1 | 214 | 25.57 | 1 | 152 | 18.16 | 19 | 2.92 | 837 | 99.05 |
| 4 | Ross Chastain | 3 | 2 | 387 | 45.80 | 2 | 267 | 31.60 | 2 | 152 | 17.99 | 0 | 80 | 9.47 | 33 | 5.07 | 845 | 100.00 |
| 5 | Brad Keselowski | 3 | 1 | 336 | 39.76 | 1 | 203 | 24.02 | 1 | 82 | 9.70 | 0 | 47 | 5.56 | 17 | 2.61 | 845 | 100.00 |
| 6 | Ricky Stenhouse Jr | 3 | 0 | 181 | 29.10 | 0 | 97 | 15.59 | 0 | 75 | 12.06 | 0 | 30 | 4.82 | 14 | 2.15 | 622 | 73.61 |
| 7 | Kyle Busch | 3 | 1 | 287 | 41.53 | 0 | 152 | 22.00 | 0 | 104 | 15.05 | 0 | 28 | 4.05 | 16 | 2.46 | 691 | 81.78 |
| 8 | Martin Truex Jr | 3 | 1 | 320 | 37.87 | 0 | 139 | 16.45 | 0 | 112 | 13.25 | 0 | 32 | 3.79 | 24 | 3.69 | 845 | 100.00 |
| 9 | Aric Almirola | 3 | 1 | 266 | 33.50 | 0 | 143 | 18.01 | 0 | 38 | 4.79 | 0 | 23 | 2.90 | 27 | 4.15 | 794 | 93.96 |
| 10 | Tyler Reddick | 3 | 1 | 348 | 51.56 | 1 | 250 | 37.04 | 0 | 168 | 24.89 | 0 | 19 | 2.81 | 10 | 1.54 | 675 | 79.88 |
| 11 | Ryan Blaney | 3 | 2 | 651 | 77.04 | 1 | 473 | 55.98 | 0 | 347 | 41.07 | 0 | 22 | 2.60 | 15 | 2.30 | 845 | 100.00 |
| 12 | Christopher Bell | 3 | 1 | 549 | 64.97 | 1 | 227 | 26.86 | 1 | 100 | 11.83 | 0 | 22 | 2.60 | 21 | 3.23 | 845 | 100.00 |
| 13 | Denny Hamlin | 3 | 1 | 548 | 74.97 | 0 | 258 | 35.29 | 0 | 82 | 11.22 | 0 | 17 | 2.33 | 13 | 2.00 | 731 | 86.51 |
| 14 | Corey LaJoie | 3 | 2 | 190 | 22.49 | 2 | 85 | 10.06 | 0 | 76 | 8.99 | 0 | 19 | 2.25 | 21 | 3.23 | 845 | 100.00 |
| 15 | Austin Cindric | 3 | 1 | 336 | 46.67 | 1 | 160 | 22.22 | 1 | 121 | 16.81 | 0 | 12 | 1.67 | 23 | 3.53 | 720 | 85.21 |
| 16 | Daniel Suarez | 3 | 2 | 347 | 43.48 | 1 | 71 | 8.90 | 0 | 46 | 5.76 | 0 | 13 | 1.63 | 16 | 2.46 | 798 | 94.44 |
| 17 | Kevin Harvick | 3 | 0 | 180 | 23.23 | 0 | 85 | 10.97 | 0 | 49 | 6.32 | 0 | 12 | 1.55 | 12 | 1.84 | 775 | 91.72 |
| 18 | Harrison Burton | 3 | 1 | 89 | 11.53 | 0 | 25 | 3.24 | 0 | 19 | 2.46 | 0 | 9 | 1.17 | 12 | 1.84 | 772 | 91.36 |
| 19 | Erik Jones | 3 | 2 | 296 | 35.03 | 1 | 114 | 13.49 | 0 | 28 | 3.31 | 0 | 9 | 1.07 | 28 | 4.30 | 845 | 100.00 |
| 20 | Chris Buescher | 3 | 1 | 207 | 33.33 | 0 | 74 | 11.92 | 0 | 7 | 1.13 | 0 | 5 | 0.81 | 8 | 1.23 | 621 | 73.49 |
| 21 | Chase Briscoe | 3 | 0 | 181 | 21.45 | 0 | 62 | 7.35 | 0 | 34 | 4.03 | 0 | 6 | 0.71 | 34 | 5.22 | 844 | 99.88 |
| 22 | Bubba Wallace | 3 | 0 | 145 | 17.26 | 0 | 112 | 13.33 | 0 | 90 | 10.71 | 0 | 3 | 0.36 | 12 | 1.84 | 840 | 99.41 |
| 23 | BJ McLeod | 3 | 0 | 9 | 1.52 | 0 | 5 | 0.85 | 0 | 4 | 0.68 | 0 | 2 | 0.34 | 10 | 1.54 | 591 | 69.94 |
| 24 | Austin Dillon | 3 | 0 | 40 | 8.85 | 0 | 17 | 3.76 | 0 | 2 | 0.44 | 0 | 1 | 0.22 | 15 | 2.30 | 452 | 53.49 |
| 25 | Kyle Larson | 3 | 0 | 171 | 25.11 | 0 | 69 | 10.13 | 0 | 29 | 4.26 | 0 | 1 | 0.15 | 19 | 2.92 | 681 | 80.59 |
| 26 | Justin Haley | 3 | 1 | 171 | 20.24 | 0 | 25 | 2.96 | 0 | 7 | 0.83 | 0 | 1 | 0.12 | 29 | 4.45 | 845 | 100.00 |
| 27 | Alex Bowman | 3 | 1 | 335 | 44.97 | 0 | 83 | 11.14 | 0 | 42 | 5.64 | 0 | 0 | 0.00 | 22 | 3.38 | 745 | 88.17 |
| 28 | Ryan Preece | 1 | 0 | 0 | 0.00 | 0 | 0 | 0.00 | 0 | 0 | 0.00 | 0 | 0 | 0.00 | 4 | 0.61 | 244 | 28.88 |
| 29 | Ty Gibbs | 1 | 1 | 24 | 9.23 | 0 | 1 | 0.38 | 0 | 0 | 0.00 | 0 | 0 | 0.00 | 10 | 1.54 | 260 | 30.77 |
| 30 | Cole Custer | 2 | 1 | 14 | 3.41 | 0 | 0 | 0.00 | 0 | 0 | 0.00 | 0 | 0 | 0.00 | 10 | 1.54 | 410 | 48.52 |
| 31 | AJ Allmendinger | 1 | 0 | 12 | 4.62 | 0 | 1 | 0.38 | 0 | 0 | 0.00 | 0 | 0 | 0.00 | 8 | 1.23 | 260 | 30.77 |
| 32 | Michael McDowell | 3 | 0 | 71 | 8.44 | 0 | 9 | 1.07 | 0 | 0 | 0.00 | 0 | 0 | 0.00 | 19 | 2.92 | 841 | 99.53 |
| 33 | Noah Gragson | 3 | 0 | 14 | 3.74 | 0 | 2 | 0.53 | 0 | 2 | 0.53 | 0 | 0 | 0.00 | 4 | 0.61 | 374 | 44.26 |
| 34 | Ty Dillon | 3 | 0 | 6 | 1.12 | 0 | 4 | 0.75 | 0 | 0 | 0.00 | 0 | 0 | 0.00 | 10 | 1.54 | 536 | 63.43 |
| 35 | Todd Gilliland | 3 | 0 | 86 | 10.53 | 0 | 21 | 2.57 | 0 | 6 | 0.73 | 0 | 0 | 0.00 | 15 | 2.30 | 817 | 96.69 |
| 36 | JJ Yeley | 1 | 0 | 1 | 0.39 | 0 | 1 | 0.39 | 0 | 1 | 0.39 | 0 | 0 | 0.00 | 3 | 0.46 | 258 | 30.53 |
| 37 | Austin Hill | 0 | 0 | 0 | 0.00 | 0 | 0 | 0.00 | 0 | 0 | 0.00 | 0 | 0 | 0.00 | 0 | 0.00 | 0 | 0.00 |
| Driver | Races | T10 Fin | T10 Laps | T10% | T5 Fin | T5 Laps | T5% | T3 Fin | T3 Laps | T3% | Wins | Led | LL% | Fast Laps | FL% | Laps | Laps Run % |
Laps run inside the Top 10, 5, 3, and led as percentage laps driver completed drafting tracks in 2023
| wdt_ID | Driver | Races | T10 Laps | T10% | T5 Laps | T5% | T3 Laps | T3% | Led | LL% | Laps | Laps Run % |
|---|---|---|---|---|---|---|---|---|---|---|---|---|
| 1 | Joey Logano | 3 | 413 | 61.83 | 329 | 49.25 | 243 | 36.38 | 156 | 23.35 | 667 | 99.85 |
| 2 | Brad Keselowski | 3 | 391 | 58.53 | 286 | 42.81 | 161 | 24.10 | 91 | 13.62 | 667 | 99.85 |
| 3 | Ryan Blaney | 3 | 349 | 52.25 | 266 | 39.82 | 219 | 32.78 | 53 | 7.93 | 668 | 100.00 |
| 4 | Aric Almirola | 3 | 349 | 52.25 | 251 | 37.57 | 147 | 22.01 | 44 | 6.59 | 616 | 92.22 |
| 5 | Bubba Wallace | 3 | 186 | 27.84 | 126 | 18.86 | 69 | 10.33 | 40 | 5.99 | 661 | 98.95 |
| 6 | Chris Buescher | 3 | 302 | 45.21 | 150 | 22.46 | 70 | 10.48 | 37 | 5.54 | 597 | 89.37 |
| 7 | Martin Truex Jr | 3 | 360 | 53.89 | 126 | 18.86 | 78 | 11.68 | 32 | 4.79 | 668 | 100.00 |
| 8 | Denny Hamlin | 3 | 471 | 70.51 | 181 | 27.10 | 88 | 13.17 | 27 | 4.04 | 668 | 100.00 |
| 9 | Christopher Bell | 3 | 303 | 45.36 | 122 | 18.26 | 73 | 10.93 | 26 | 3.89 | 668 | 100.00 |
| 10 | Harrison Burton | 3 | 103 | 15.42 | 46 | 6.89 | 30 | 4.49 | 21 | 3.14 | 584 | 87.43 |
| 11 | Alex Bowman | 3 | 224 | 33.53 | 98 | 14.67 | 71 | 10.63 | 20 | 2.99 | 668 | 100.00 |
| 12 | Kyle Busch | 3 | 253 | 37.87 | 108 | 16.17 | 86 | 12.87 | 16 | 2.40 | 667 | 99.85 |
| 13 | Ricky Stenhouse Jr | 3 | 110 | 16.47 | 47 | 7.04 | 34 | 5.09 | 16 | 2.40 | 668 | 100.00 |
| 14 | Ross Chastain | 3 | 153 | 22.90 | 71 | 10.63 | 32 | 4.79 | 14 | 2.10 | 668 | 100.00 |
| 15 | Kevin Harvick | 3 | 241 | 36.08 | 137 | 20.51 | 78 | 11.68 | 13 | 1.95 | 598 | 89.52 |
| 16 | Daniel Suarez | 3 | 137 | 20.51 | 31 | 4.64 | 12 | 1.80 | 7 | 1.05 | 621 | 92.96 |
| 17 | Chase Briscoe | 3 | 71 | 10.63 | 39 | 5.84 | 34 | 5.09 | 6 | 0.90 | 637 | 95.36 |
| 18 | Kyle Larson | 3 | 267 | 39.97 | 133 | 19.91 | 74 | 11.08 | 6 | 0.90 | 609 | 91.17 |
| 19 | Ryan Preece | 3 | 159 | 23.80 | 89 | 13.32 | 52 | 7.78 | 6 | 0.90 | 614 | 91.92 |
| 20 | Austin Cindric | 3 | 412 | 61.68 | 176 | 26.35 | 97 | 14.52 | 5 | 0.75 | 666 | 99.70 |
| 21 | Ty Gibbs | 3 | 142 | 21.26 | 69 | 10.33 | 42 | 6.29 | 4 | 0.60 | 664 | 99.40 |
| 22 | Erik Jones | 3 | 64 | 9.58 | 22 | 3.29 | 8 | 1.20 | 3 | 0.45 | 575 | 86.08 |
| 23 | AJ Allmendinger | 3 | 72 | 10.78 | 14 | 2.10 | 3 | 0.45 | 1 | 0.15 | 667 | 99.85 |
| 24 | BJ McLeod | 3 | 3 | 0.45 | 2 | 0.30 | 2 | 0.30 | 1 | 0.15 | 589 | 88.17 |
| 25 | Noah Gragson | 3 | 115 | 17.22 | 57 | 8.53 | 35 | 5.24 | 1 | 0.15 | 659 | 98.65 |
| 26 | William Byron | 3 | 201 | 30.09 | 92 | 13.77 | 35 | 5.24 | 1 | 0.15 | 590 | 88.32 |
| 27 | Michael McDowell | 3 | 82 | 12.28 | 34 | 5.09 | 3 | 0.45 | 0 | 0.00 | 657 | 98.35 |
| 28 | Austin Dillon | 3 | 48 | 7.19 | 15 | 2.25 | 7 | 1.05 | 0 | 0.00 | 603 | 90.27 |
| 29 | Carson Hocevar | 0 | 0 | 0.00 | 0 | 0.00 | 0 | 0.00 | 0 | 0.00 | 0 | 0.00 |
| 30 | Corey LaJoie | 3 | 155 | 23.20 | 16 | 2.40 | 3 | 0.45 | 0 | 0.00 | 668 | 100.00 |
| 31 | Gray Gaulding | 0 | 0 | 0.00 | 0 | 0.00 | 0 | 0.00 | 0 | 0.00 | 0 | 0.00 |
| 32 | JJ Yeley | 2 | 11 | 1.65 | 5 | 0.75 | 2 | 0.30 | 0 | 0.00 | 454 | 67.96 |
| 33 | Justin Haley | 3 | 85 | 12.72 | 30 | 4.49 | 8 | 1.20 | 0 | 0.00 | 659 | 98.65 |
| 34 | Todd Gilliland | 3 | 51 | 7.63 | 0 | 0.00 | 0 | 0.00 | 0 | 0.00 | 664 | 99.40 |
| 35 | Ty Dillon | 3 | 31 | 4.64 | 12 | 1.80 | 7 | 1.05 | 0 | 0.00 | 482 | 72.16 |
| 36 | Tyler Reddick | 3 | 158 | 23.65 | 110 | 16.47 | 59 | 8.83 | 0 | 0.00 | 573 | 85.78 |
| Driver | Races | T10 Laps | T10% | T5 Laps | T5% | T3 Laps | T3% | Led | LL% | Laps | Laps Run % |
Thanks for checking out the Front Runners! Let’s WIN THE RACE!