
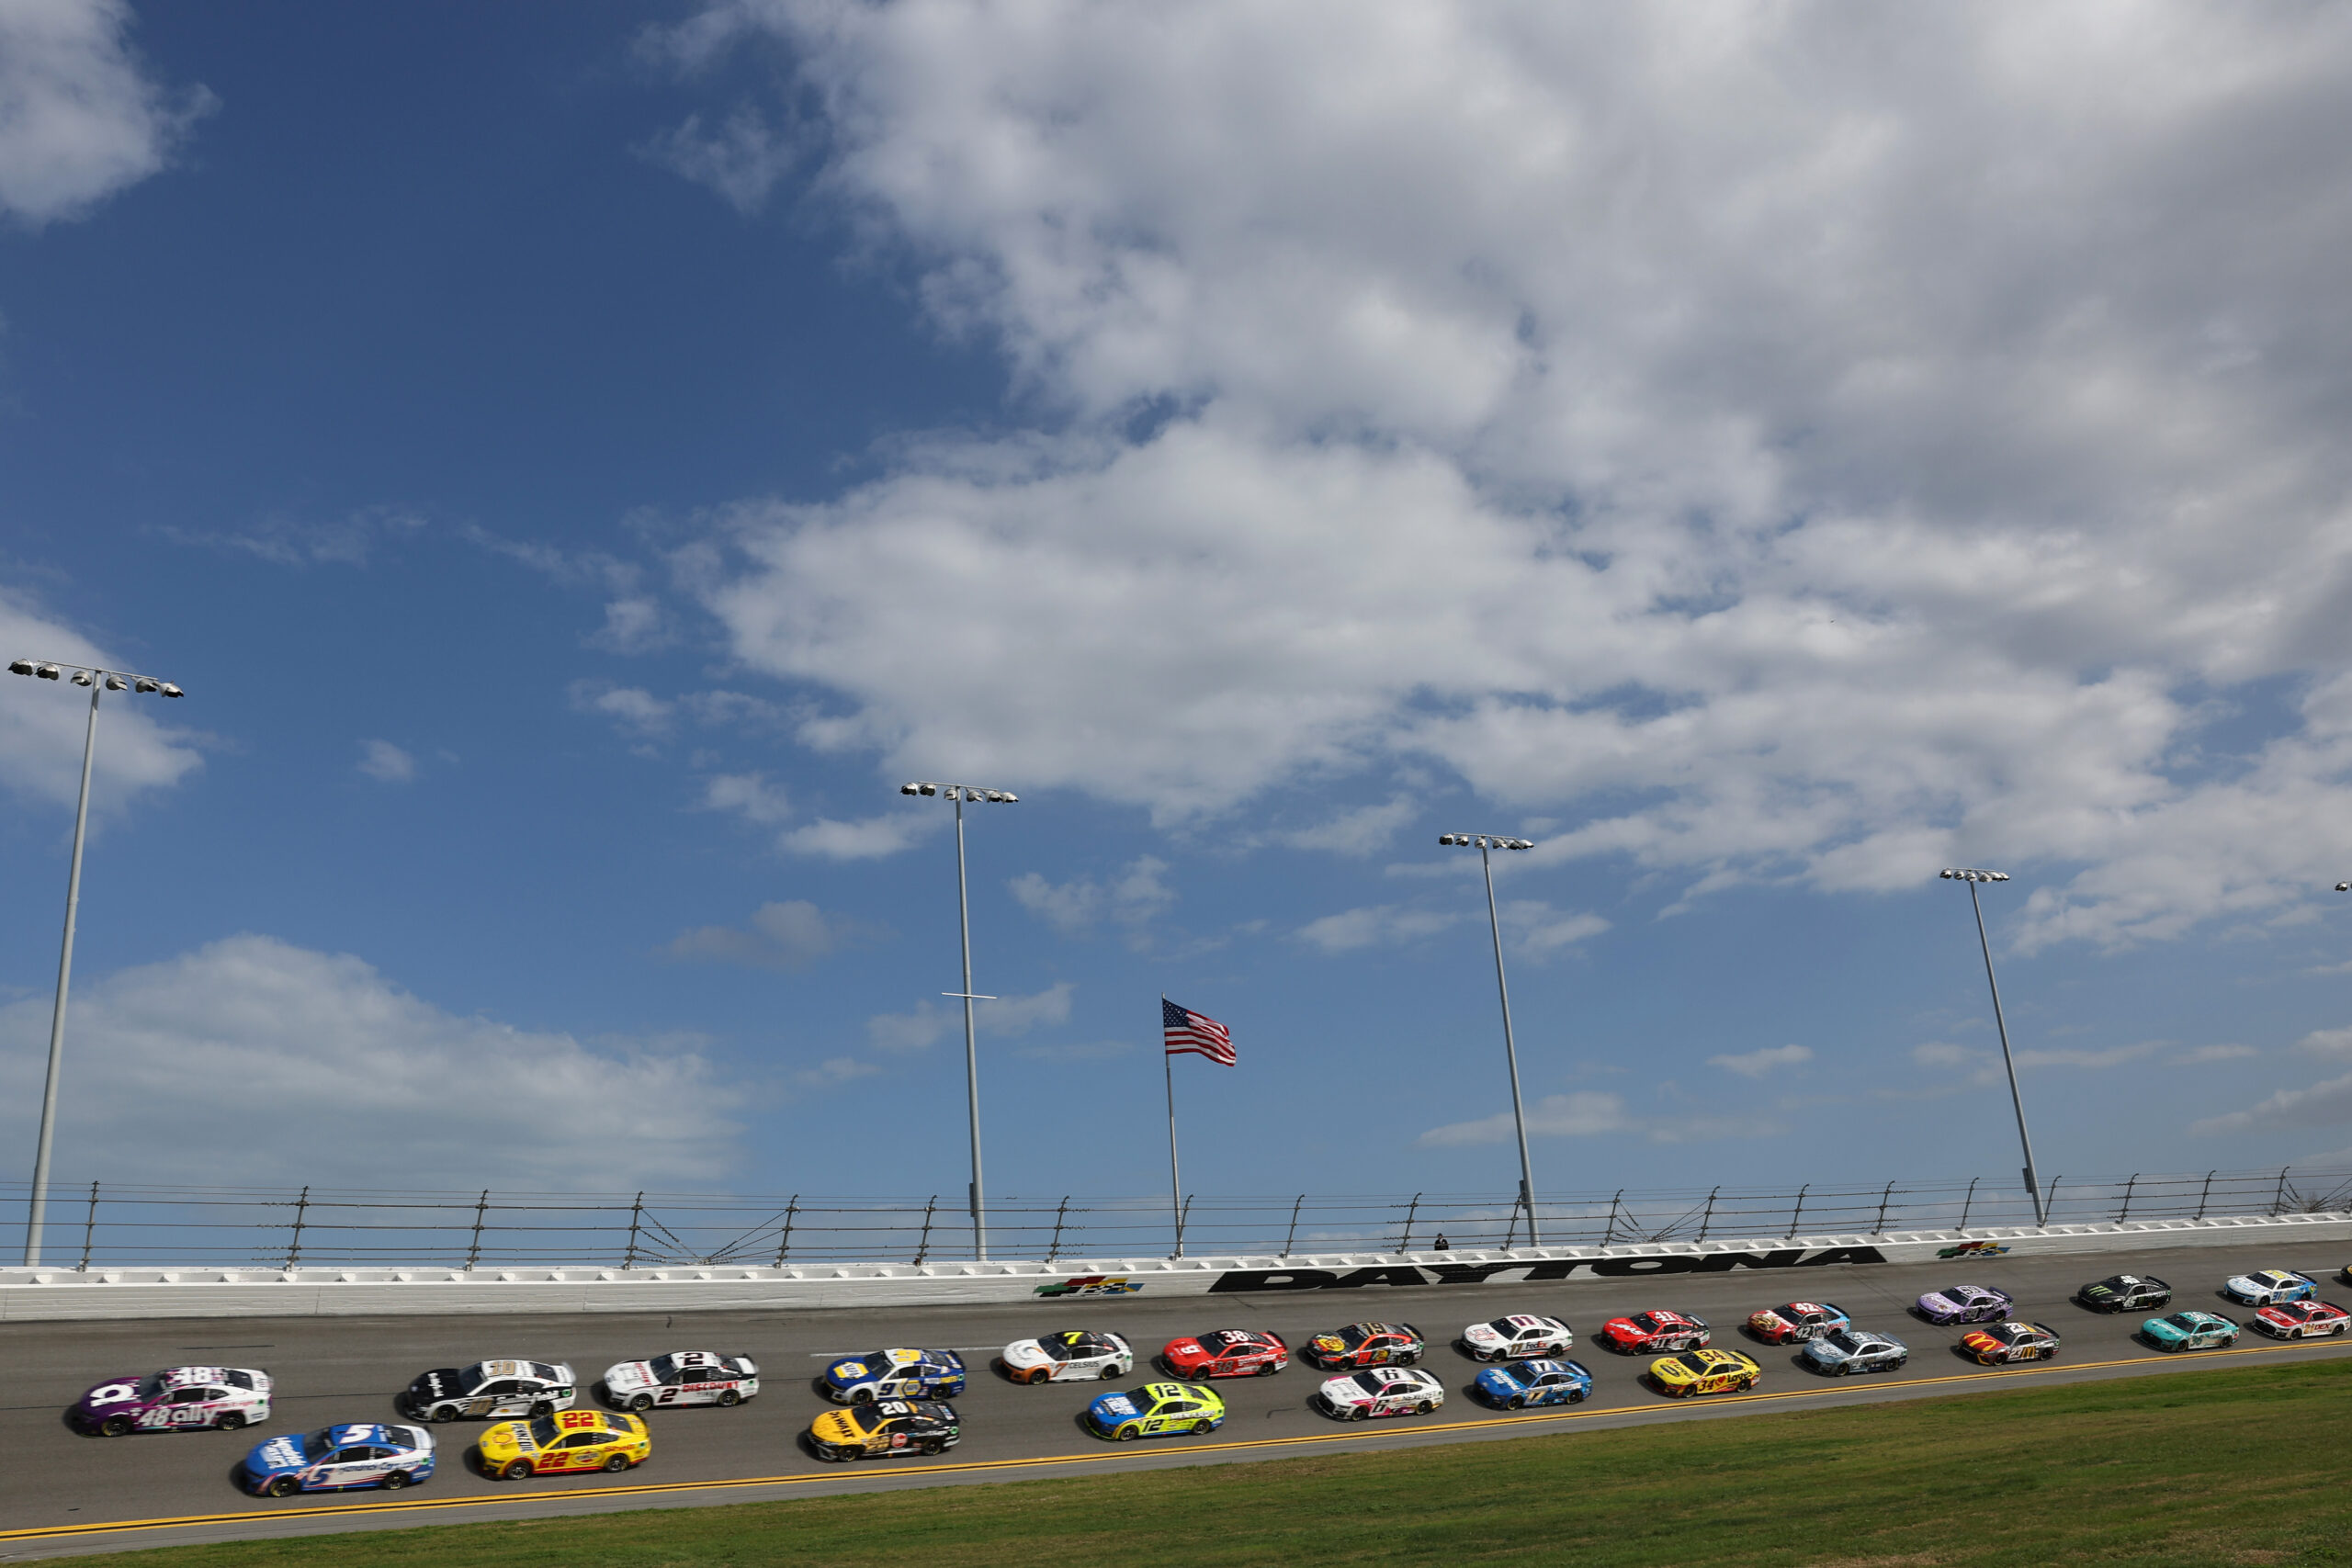
2023 Coke Zero Sugar 400 at Daytona International Speedway
Front Runners highlights the drivers that lead laps, run fast laps, and run inside the top 10, 5, & 3 the most at correlated track types.
There is nothing complicated about selection of relevant tracks for Daytona. Daytona and Talladega are the relevant tracks. As the two true drafting, superspeedway, plate, or whatever you want to call them, Daytona and Talladega race differently than any other type of track. Both tracks are around two and a half miles long and feature steep banking in the turns. Pack racing in the draft is the name of the game at these venues.
Although Atlanta has recently been reconfigured to race more like a superspeedway, Atlanta is not a comp for Daytona or Talladega. Atlanta is significantly shorter and while it does require drafting, it also requires more of the intermediate skill set. So ultimately Daytona and Talladega are relevant comps for Atlanta, but the inverse is not true. So we have one data set this week, the six races at Daytona and Talladega in the Gen 7 car.
The charts below are sorted by percentage of laps led by default. There are also a few more columns that you can choose to display but for ease of display those columns are hidden by default. Also included as the final column is the drivers average running position across all laps completed as the tracks in the data set.
A final note on this week’s data, there was a corruption of part of the 2022 Daytona 500 data, with a few random laps mid race missing.
Laps run inside the Top 10, 5, 3, and led as percentage laps driver completed at Daytona (3) and Talladega (3) in 2022 and 2023
| wdt_ID | Driver | Make | Races | T10 Fin | T10 Laps | T10% | T5 Fin | T5 Laps | T5% | T3 Fin | T3 Laps | T3% | Wins | Led | LL% | Fast Laps | FL% | Laps | Laps Run % | Ave Running Pos |
|---|---|---|---|---|---|---|---|---|---|---|---|---|---|---|---|---|---|---|---|---|
| 72 | Ryan Blaney | 6 | 4 | 491 | 43.45 | 3 | 338 | 29.91 | 2 | 259 | 22.92 | 0 | 139 | 12.30 | 15 | 1.66 | 1,130 | 99.47 | 14.81 | |
| 73 | Brad Keselowski | 6 | 2 | 415 | 41.25 | 1 | 262 | 26.04 | 0 | 187 | 18.59 | 0 | 102 | 10.14 | 27 | 2.98 | 1,006 | 88.56 | 16.09 | |
| 74 | Erik Jones | 6 | 3 | 526 | 51.57 | 0 | 301 | 29.51 | 0 | 176 | 17.25 | 0 | 76 | 7.45 | 21 | 2.32 | 1,020 | 89.79 | 11.47 | |
| 75 | Bubba Wallace | 6 | 1 | 447 | 39.45 | 1 | 280 | 24.71 | 1 | 175 | 15.45 | 0 | 67 | 5.91 | 44 | 4.86 | 1,133 | 99.74 | 14.78 | |
| 76 | Chase Elliott | 6 | 3 | 492 | 48.28 | 1 | 232 | 22.77 | 1 | 161 | 15.80 | 1 | 59 | 5.79 | 20 | 2.21 | 1,019 | 89.70 | 11.18 | |
| 77 | Denny Hamlin | 6 | 1 | 502 | 51.02 | 1 | 224 | 22.76 | 0 | 149 | 15.14 | 0 | 56 | 5.69 | 13 | 1.43 | 984 | 86.62 | 12.43 | |
| 78 | Aric Almirola | 6 | 1 | 463 | 41.60 | 1 | 298 | 26.77 | 0 | 201 | 18.06 | 0 | 63 | 5.66 | 17 | 1.88 | 1,113 | 97.98 | 13.02 | |
| 79 | Kyle Larson | 6 | 1 | 515 | 53.09 | 1 | 272 | 28.04 | 0 | 183 | 18.87 | 0 | 48 | 4.95 | 17 | 1.88 | 970 | 85.39 | 10.58 | |
| 80 | Ross Chastain | 6 | 3 | 364 | 38.44 | 2 | 187 | 19.75 | 1 | 111 | 11.72 | 1 | 45 | 4.75 | 19 | 2.10 | 947 | 83.36 | 14.54 | |
| 81 | William Byron | 5 | 1 | 339 | 38.74 | 0 | 214 | 24.46 | 0 | 140 | 16.00 | 0 | 40 | 4.57 | 20 | 2.21 | 875 | 77.02 | 12.68 | |
| 82 | Kyle Busch | 6 | 4 | 471 | 41.50 | 2 | 220 | 19.38 | 2 | 134 | 11.81 | 1 | 50 | 4.41 | 33 | 3.64 | 1,135 | 99.91 | 13.93 | |
| 83 | Martin Truex Jr | 6 | 2 | 538 | 47.36 | 1 | 261 | 22.98 | 0 | 132 | 11.62 | 0 | 47 | 4.14 | 25 | 2.76 | 1,136 | 100.00 | 14.15 | |
| 84 | Daniel Suarez | 6 | 3 | 256 | 25.20 | 0 | 139 | 13.68 | 0 | 77 | 7.58 | 0 | 39 | 3.84 | 20 | 2.21 | 1,016 | 89.44 | 17.86 | |
| 85 | Chris Buescher | 6 | 2 | 381 | 38.84 | 2 | 208 | 21.20 | 1 | 158 | 16.11 | 0 | 34 | 3.47 | 22 | 2.43 | 981 | 86.36 | 15.99 | |
| 86 | Harrison Burton | 6 | 0 | 194 | 27.40 | 0 | 92 | 12.99 | 0 | 60 | 8.47 | 0 | 24 | 3.39 | 7 | 0.77 | 708 | 62.32 | 15.89 | |
| 87 | Alex Bowman | 5 | 2 | 237 | 25.27 | 1 | 127 | 13.54 | 0 | 85 | 9.06 | 0 | 31 | 3.30 | 21 | 2.32 | 938 | 82.57 | 17.66 | |
| 88 | Joey Logano | 6 | 1 | 388 | 37.63 | 1 | 242 | 23.47 | 1 | 157 | 15.23 | 0 | 32 | 3.10 | 28 | 3.09 | 1,031 | 90.76 | 14.67 | |
| 89 | Christopher Bell | 6 | 2 | 358 | 37.45 | 1 | 174 | 18.20 | 1 | 129 | 13.49 | 0 | 28 | 2.93 | 4 | 0.44 | 956 | 84.15 | 15.70 | |
| 90 | Austin Cindric | 6 | 3 | 451 | 39.77 | 2 | 225 | 19.84 | 2 | 135 | 11.90 | 1 | 33 | 2.91 | 17 | 1.88 | 1,134 | 99.82 | 14.76 | |
| 91 | Tyler Reddick | 6 | 1 | 199 | 23.86 | 1 | 76 | 9.11 | 1 | 50 | 6.00 | 0 | 24 | 2.88 | 13 | 1.43 | 834 | 73.42 | 17.07 | |
| 92 | Ricky Stenhouse Jr | 6 | 1 | 293 | 28.92 | 1 | 122 | 12.04 | 1 | 62 | 6.12 | 1 | 24 | 2.37 | 43 | 4.75 | 1,013 | 89.17 | 16.70 | |
| 93 | Ryan Preece | 2 | 0 | 159 | 42.97 | 0 | 89 | 24.05 | 0 | 52 | 14.05 | 0 | 6 | 1.62 | 8 | 0.88 | 370 | 32.57 | 14.08 | |
| 94 | Austin Dillon | 6 | 2 | 147 | 13.78 | 2 | 43 | 4.03 | 2 | 34 | 3.19 | 1 | 12 | 1.12 | 22 | 2.43 | 1,067 | 93.93 | 20.50 | |
| 95 | Kevin Harvick | 6 | 1 | 509 | 46.15 | 0 | 296 | 26.84 | 0 | 116 | 10.52 | 0 | 12 | 1.09 | 18 | 1.99 | 1,103 | 97.10 | 12.93 | |
| 96 | Corey LaJoie | 6 | 0 | 128 | 13.21 | 0 | 34 | 3.51 | 0 | 15 | 1.55 | 0 | 8 | 0.83 | 20 | 2.21 | 969 | 85.30 | 21.16 | |
| 97 | Justin Haley | 6 | 0 | 223 | 20.27 | 0 | 76 | 6.91 | 0 | 27 | 2.45 | 0 | 8 | 0.73 | 21 | 2.32 | 1,100 | 96.83 | 19.92 | |
| 98 | Ty Gibbs | 4 | 0 | 119 | 20.34 | 0 | 68 | 11.62 | 0 | 42 | 7.18 | 0 | 4 | 0.68 | 10 | 1.10 | 585 | 51.50 | 20.56 | |
| 99 | Chase Briscoe | 6 | 3 | 180 | 19.17 | 2 | 60 | 6.39 | 1 | 35 | 3.73 | 0 | 6 | 0.64 | 25 | 2.76 | 939 | 82.66 | 21.78 | |
| 100 | BJ McLeod | 6 | 1 | 34 | 3.09 | 0 | 10 | 0.91 | 0 | 7 | 0.64 | 0 | 5 | 0.45 | 21 | 2.32 | 1,101 | 96.92 | 30.96 | |
| 101 | AJ Allmendinger | 2 | 1 | 60 | 14.74 | 0 | 13 | 3.19 | 0 | 3 | 0.74 | 0 | 1 | 0.25 | 15 | 1.66 | 407 | 35.83 | 22.54 | |
| 102 | Michael McDowell | 6 | 3 | 291 | 27.30 | 1 | 109 | 10.23 | 1 | 19 | 1.78 | 0 | 2 | 0.19 | 33 | 3.64 | 1,066 | 93.84 | 20.78 | |
| 103 | Ty Dillon | 6 | 0 | 116 | 13.89 | 0 | 17 | 2.04 | 0 | 8 | 0.96 | 0 | 1 | 0.12 | 29 | 3.20 | 835 | 73.50 | 19.33 | |
| 104 | Todd Gilliland | 6 | 2 | 282 | 27.35 | 0 | 107 | 10.38 | 0 | 41 | 3.98 | 0 | 1 | 0.10 | 18 | 1.99 | 1,031 | 90.76 | 17.49 | |
| 105 | JJ Yeley | 2 | 0 | 10 | 2.63 | 0 | 4 | 1.05 | 0 | 1 | 0.26 | 0 | 0 | 0.00 | 7 | 0.77 | 380 | 33.45 | 26.87 | |
| 106 | Austin Hill | 1 | 0 | 2 | 1.02 | 0 | 1 | 0.51 | 0 | 1 | 0.51 | 0 | 0 | 0.00 | 12 | 1.32 | 196 | 17.25 | 32.44 | |
| 107 | Riley Herbst | 2 | 1 | 4 | 0.98 | 0 | 2 | 0.49 | 0 | 1 | 0.25 | 0 | 0 | 0.00 | 13 | 1.43 | 408 | 35.92 | 28.74 | |
| Driver | Make | Races | T10 Fin | T10 Laps | T10% | T5 Fin | T5 Laps | T5% | T3 Fin | T3 Laps | T3% | Wins | Led | LL% | Fast Laps | FL% | Laps | Laps Run % | Ave Running Pos |
*Chandler Smith, Josh Berry, and Brennan Poole have not started any of the 6 races in this data set and so they are not on this chart.