
2023 Verizon 200 Indianapolis Motor Speedway Road Course
Front Runners highlights the drivers that lead laps, run fast laps, and run inside the top 10, 5, & 3 the most at correlated track types.
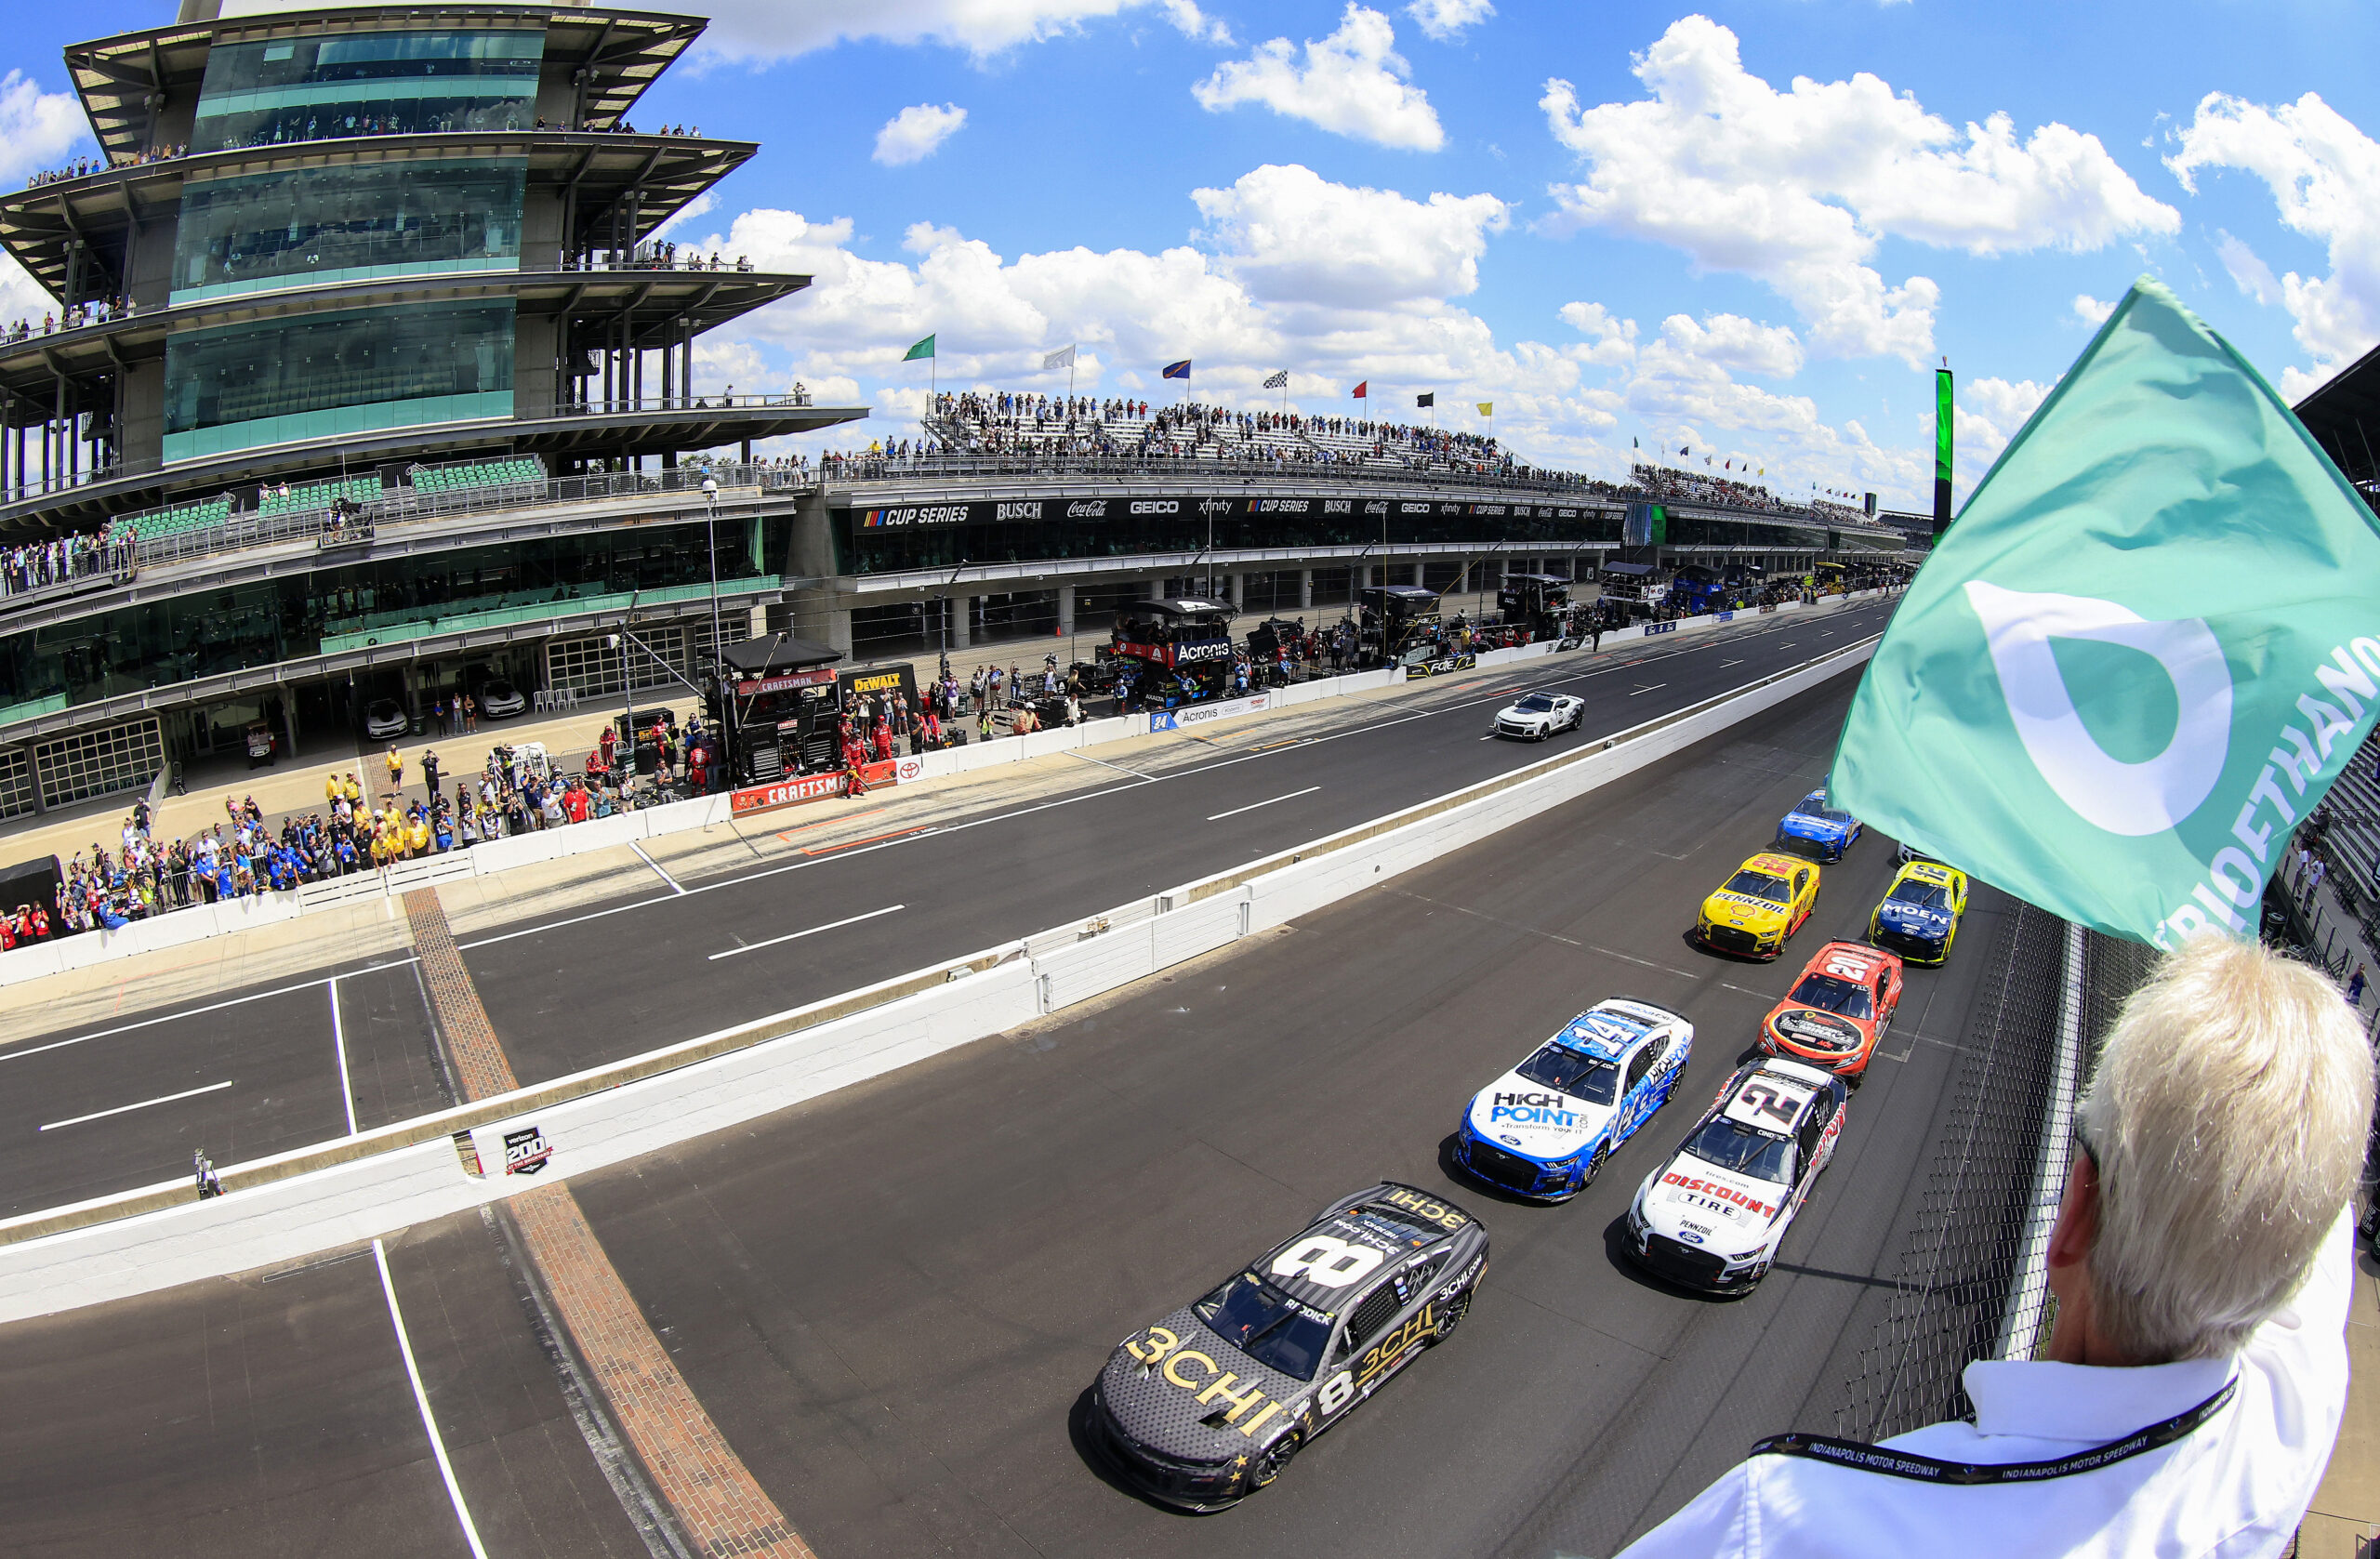
The NASCAR Cup Series makes its fourth visit to a track that has both left and right turns (two road courses and one street course) this weekend when the Cup Series heads to the Indianapolis Motor Speedway Road Course. The IMS Road Course has produced a fair amount of chaos the past two years. To try and reduce the complete mess that happened during some restarts last year NASCAR is moving the restart zone this year.
Since we have three races under our belt this year we have two data sets this week. The first data set is just driver performance at 2023 road/street courses. The second is driver performance at all nine street/road course races in the Gen 7 Car.
The charts below are sorted by percentage of laps led by default. There are also a few more columns that you can choose to display but for ease of display those columns are hidden by default. Also included as the final column is the drivers average running position across all laps completed as the tracks in the data set.
Drivers who have not started an event at one of the relevant races are omitted from these tables.
Laps run inside the Top 10, 5, 3, and led as percentage laps driver completed at 2023 COTA, 2023 Sonoma, and 2023 Chicago Street Course
| wdt_ID | Driver | Races | T10 Fin | T10 Laps | T10% | T5 Fin | T5 Laps | T5% | T3 Fin | T3 Laps | T3% | Wins | Led | LL% | Fast Laps | FL% | Laps | Laps Run % | Ave Running Pos |
|---|---|---|---|---|---|---|---|---|---|---|---|---|---|---|---|---|---|---|---|
| 1 | Martin Truex Jr | 3 | 1 | 171 | 65.27 | 1 | 135 | 51.53 | 1 | 85 | 32.44 | 1 | 51 | 19.47 | 22 | 11.22 | 262 | 99.62 | 9.80 |
| 2 | Tyler Reddick | 3 | 1 | 183 | 69.85 | 1 | 138 | 52.67 | 1 | 115 | 43.89 | 1 | 49 | 18.70 | 21 | 10.71 | 262 | 99.62 | 10.08 |
| 3 | Christopher Bell | 3 | 1 | 176 | 67.43 | 0 | 105 | 40.23 | 0 | 91 | 34.87 | 0 | 38 | 14.56 | 18 | 9.18 | 261 | 99.24 | 9.32 |
| 4 | Shane Van Gisbergen | 1 | 1 | 70 | 89.74 | 1 | 62 | 79.49 | 1 | 47 | 60.26 | 1 | 9 | 11.54 | 12 | 6.12 | 78 | 29.66 | 4.87 |
| 5 | William Byron | 3 | 1 | 108 | 41.06 | 1 | 78 | 29.66 | 0 | 62 | 23.57 | 0 | 28 | 10.65 | 7 | 3.57 | 263 | 100.00 | 12.02 |
| 6 | Justin Haley | 3 | 1 | 32 | 12.17 | 1 | 31 | 11.79 | 1 | 31 | 11.79 | 0 | 23 | 8.75 | 5 | 2.55 | 263 | 100.00 | 22.15 |
| 7 | Kyle Busch | 3 | 3 | 158 | 60.08 | 3 | 100 | 38.02 | 2 | 67 | 25.48 | 0 | 17 | 6.46 | 9 | 4.59 | 263 | 100.00 | 12.10 |
| 8 | Chase Elliott | 2 | 2 | 104 | 55.32 | 2 | 79 | 42.02 | 1 | 52 | 27.66 | 0 | 7 | 3.72 | 6 | 3.06 | 188 | 71.48 | 11.71 |
| 9 | Austin Cindric | 3 | 2 | 69 | 26.24 | 0 | 24 | 9.13 | 0 | 21 | 7.98 | 0 | 2 | 0.76 | 4 | 2.04 | 263 | 100.00 | 21.53 |
| 10 | Michael McDowell | 3 | 2 | 198 | 75.29 | 0 | 67 | 25.48 | 0 | 20 | 7.60 | 0 | 1 | 0.38 | 3 | 1.53 | 263 | 100.00 | 9.48 |
| 11 | Chris Buescher | 3 | 3 | 140 | 53.23 | 1 | 27 | 10.27 | 0 | 3 | 1.14 | 0 | 1 | 0.38 | 4 | 2.04 | 263 | 100.00 | 11.55 |
| 12 | Joey Logano | 3 | 2 | 132 | 50.19 | 1 | 67 | 25.48 | 1 | 33 | 12.55 | 0 | 1 | 0.38 | 3 | 1.53 | 263 | 100.00 | 11.68 |
| 13 | Ty Gibbs | 3 | 2 | 126 | 47.91 | 0 | 18 | 6.84 | 0 | 3 | 1.14 | 0 | 1 | 0.38 | 6 | 3.06 | 263 | 100.00 | 13.31 |
| 14 | Daniel Suarez | 3 | 0 | 119 | 45.25 | 0 | 80 | 30.42 | 0 | 11 | 4.18 | 0 | 1 | 0.38 | 9 | 4.59 | 263 | 100.00 | 15.25 |
| 15 | Ross Chastain | 3 | 2 | 110 | 41.83 | 1 | 53 | 20.15 | 0 | 24 | 9.13 | 0 | 1 | 0.38 | 5 | 2.55 | 263 | 100.00 | 13.22 |
| 16 | AJ Allmendinger | 3 | 1 | 158 | 63.71 | 0 | 48 | 19.35 | 0 | 23 | 9.27 | 0 | 0 | 0.00 | 7 | 3.57 | 248 | 94.30 | 9.47 |
| 17 | Kyle Larson | 3 | 2 | 141 | 53.61 | 1 | 52 | 19.77 | 0 | 12 | 4.56 | 0 | 0 | 0.00 | 8 | 4.08 | 263 | 100.00 | 13.11 |
| 18 | Alex Bowman | 3 | 1 | 68 | 30.22 | 1 | 33 | 14.67 | 1 | 5 | 2.22 | 0 | 0 | 0.00 | 2 | 1.02 | 225 | 85.55 | 12.13 |
| 19 | Austin Dillon | 3 | 0 | 57 | 24.36 | 0 | 30 | 12.82 | 0 | 21 | 8.97 | 0 | 0 | 0.00 | 1 | 0.51 | 234 | 88.97 | 18.16 |
| 20 | Ricky Stenhouse Jr | 3 | 1 | 39 | 14.89 | 0 | 8 | 3.05 | 0 | 1 | 0.38 | 0 | 0 | 0.00 | 1 | 0.51 | 262 | 99.62 | 18.95 |
| 21 | Kevin Harvick | 3 | 0 | 38 | 14.45 | 0 | 11 | 4.18 | 0 | 4 | 1.52 | 0 | 0 | 0.00 | 1 | 0.51 | 263 | 100.00 | 18.71 |
| 22 | Ryan Preece | 3 | 0 | 21 | 8.20 | 0 | 2 | 0.78 | 0 | 0 | 0.00 | 0 | 0 | 0.00 | 0 | 0.00 | 256 | 97.34 | 17.66 |
| 23 | Erik Jones | 3 | 0 | 18 | 6.87 | 0 | 2 | 0.76 | 0 | 1 | 0.38 | 0 | 0 | 0.00 | 1 | 0.51 | 262 | 99.62 | 23.16 |
| 24 | Chase Briscoe | 3 | 0 | 17 | 6.46 | 0 | 1 | 0.38 | 0 | 0 | 0.00 | 0 | 0 | 0.00 | 0 | 0.00 | 263 | 100.00 | 19.58 |
| 25 | Aric Almirola | 3 | 0 | 16 | 6.11 | 0 | 0 | 0.00 | 0 | 0 | 0.00 | 0 | 0 | 0.00 | 0 | 0.00 | 262 | 99.62 | 16.66 |
| 26 | Bubba Wallace | 3 | 0 | 11 | 5.56 | 0 | 1 | 0.51 | 0 | 0 | 0.00 | 0 | 0 | 0.00 | 0 | 0.00 | 198 | 75.29 | 22.25 |
| 27 | Ryan Blaney | 3 | 0 | 13 | 4.96 | 0 | 7 | 2.67 | 0 | 2 | 0.76 | 0 | 0 | 0.00 | 3 | 1.53 | 262 | 99.62 | 28.67 |
| 28 | Todd Gilliland | 3 | 1 | 6 | 2.28 | 0 | 0 | 0.00 | 0 | 0 | 0.00 | 0 | 0 | 0.00 | 3 | 1.53 | 263 | 100.00 | 24.82 |
| 29 | Harrison Burton | 3 | 0 | 4 | 1.52 | 0 | 1 | 0.38 | 0 | 1 | 0.38 | 0 | 0 | 0.00 | 0 | 0.00 | 263 | 100.00 | 29.17 |
| 30 | Josh Bilicki | 3 | 0 | 4 | 1.52 | 0 | 1 | 0.38 | 0 | 1 | 0.38 | 0 | 0 | 0.00 | 0 | 0.00 | 263 | 100.00 | 25.54 |
| 31 | Brad Keselowski | 3 | 0 | 2 | 0.82 | 0 | 0 | 0.00 | 0 | 0 | 0.00 | 0 | 0 | 0.00 | 8 | 4.08 | 244 | 92.78 | 24.70 |
| 32 | Corey LaJoie | 3 | 0 | 1 | 0.38 | 0 | 0 | 0.00 | 0 | 0 | 0.00 | 0 | 0 | 0.00 | 6 | 3.06 | 263 | 100.00 | 23.09 |
| 33 | Andy Lally | 2 | 0 | 0 | 0.00 | 0 | 0 | 0.00 | 0 | 0 | 0.00 | 0 | 0 | 0.00 | 0 | 0.00 | 187 | 71.10 | 30.56 |
| 34 | Ty Dillon | 3 | 0 | 0 | 0.00 | 0 | 0 | 0.00 | 0 | 0 | 0.00 | 0 | 0 | 0.00 | 0 | 0.00 | 178 | 67.68 | 26.64 |
| 35 | Denny Hamlin | 3 | 0 | 67 | 27.35 | 0 | 53 | 21.63 | 0 | 53 | 23.63 | 0 | 33 | 13.47 | 15 | 7.65 | 245 | 93.16 | 13.49 |
| Driver | Races | T10 Fin | T10 Laps | T10% | T5 Fin | T5 Laps | T5% | T3 Fin | T3 Laps | T3% | Wins | Led | LL% | Fast Laps | FL% | Laps | Laps Run % | Ave Running Pos |
Laps run inside the Top 10, 5, 3, and led as percentage laps driver completed at road and street courses in the Gen 7 car (2022/23 COTA, 2022/23 Sonoma, 2023 Chicago Street Course, 2022 Road America, 2022 Indy RC, 2022 Watkins Glen, 2022 Charlotte Roval)
| wdt_ID | Driver | Races | T10 Fin | T10 Laps | T10% | T5 Fin | T5 Laps | T5% | T3 Fin | T3 Laps | T3% | Wins | Led | LL% | Fast Laps | FL% | Laps | Laps Run % | Ave Running Pos |
|---|---|---|---|---|---|---|---|---|---|---|---|---|---|---|---|---|---|---|---|
| 1 | Chase Elliott | 8 | 6 | 514 | 71.69 | 5 | 378 | 52.72 | 2 | 269 | 37.52 | 0 | 128 | 17.85 | 80 | 12.86 | 717 | 90.53 | 9.49 |
| 2 | Tyler Reddick | 9 | 6 | 587 | 76.43 | 4 | 479 | 62.37 | 3 | 337 | 43.88 | 3 | 128 | 16.67 | 72 | 11.58 | 768 | 96.97 | 14.15 |
| 3 | Shane Van Gisbergen | 1 | 1 | 70 | 89.74 | 1 | 62 | 79.49 | 1 | 47 | 60.26 | 1 | 9 | 11.54 | 12 | 1.93 | 78 | 9.85 | 4.87 |
| 4 | Daniel Suarez | 9 | 3 | 403 | 51.21 | 3 | 254 | 32.27 | 1 | 125 | 15.88 | 1 | 63 | 8.01 | 34 | 5.47 | 787 | 99.37 | 13.51 |
| 5 | Christopher Bell | 9 | 4 | 402 | 50.89 | 2 | 167 | 21.14 | 2 | 122 | 15.44 | 1 | 57 | 7.22 | 35 | 5.63 | 790 | 99.75 | 14.45 |
| 6 | Martin Truex Jr | 9 | 2 | 266 | 33.63 | 1 | 138 | 17.45 | 1 | 85 | 10.75 | 1 | 51 | 6.45 | 26 | 4.18 | 791 | 99.87 | 16.68 |
| 7 | Joey Logano | 9 | 4 | 300 | 37.88 | 2 | 162 | 20.45 | 2 | 104 | 13.13 | 0 | 49 | 6.19 | 10 | 1.61 | 792 | 100.00 | 14.69 |
| 8 | Ross Chastain | 9 | 5 | 382 | 48.97 | 3 | 179 | 22.95 | 1 | 90 | 11.54 | 1 | 35 | 4.49 | 28 | 4.50 | 780 | 98.48 | 17.18 |
| 9 | Kyle Larson | 9 | 4 | 348 | 45.91 | 3 | 185 | 24.41 | 2 | 124 | 16.36 | 1 | 31 | 4.09 | 40 | 6.43 | 758 | 95.71 | 15.47 |
| 10 | AJ Allmendinger | 9 | 5 | 443 | 57.09 | 2 | 233 | 30.03 | 1 | 156 | 20.10 | 0 | 30 | 3.87 | 44 | 7.07 | 776 | 97.98 | 10.65 |
| 11 | William Byron | 9 | 2 | 237 | 32.38 | 1 | 147 | 20.08 | 0 | 103 | 14.07 | 0 | 28 | 3.83 | 20 | 3.22 | 732 | 92.42 | 15.47 |
| 12 | Justin Haley | 9 | 2 | 161 | 20.33 | 2 | 105 | 13.26 | 1 | 53 | 6.69 | 0 | 23 | 2.90 | 11 | 1.77 | 792 | 100.00 | 21.61 |
| 13 | Ryan Blaney | 9 | 2 | 266 | 33.80 | 0 | 141 | 17.92 | 0 | 78 | 9.91 | 0 | 22 | 2.80 | 14 | 2.25 | 787 | 99.37 | 21.06 |
| 14 | Chase Briscoe | 9 | 1 | 144 | 18.18 | 0 | 70 | 8.84 | 0 | 62 | 7.83 | 0 | 18 | 2.27 | 6 | 0.96 | 792 | 100.00 | 17.98 |
| 15 | Kyle Busch | 9 | 4 | 302 | 38.18 | 4 | 151 | 19.09 | 3 | 100 | 12.64 | 0 | 17 | 2.15 | 21 | 3.38 | 791 | 99.87 | 17.38 |
| 16 | Michael McDowell | 9 | 6 | 595 | 75.22 | 1 | 259 | 32.74 | 1 | 115 | 14.54 | 0 | 15 | 1.90 | 16 | 2.57 | 791 | 99.87 | 14.33 |
| 17 | Austin Cindric | 9 | 6 | 305 | 38.51 | 2 | 110 | 13.89 | 1 | 68 | 8.59 | 0 | 13 | 1.64 | 17 | 2.73 | 792 | 100.00 | 15.19 |
| 18 | Todd Gilliland | 9 | 2 | 75 | 10.36 | 1 | 22 | 3.04 | 0 | 11 | 1.52 | 0 | 9 | 1.24 | 8 | 1.29 | 724 | 91.41 | 22.69 |
| 19 | Austin Dillon | 9 | 2 | 163 | 21.39 | 0 | 55 | 7.22 | 0 | 40 | 5.25 | 0 | 6 | 0.79 | 3 | 0.48 | 762 | 96.21 | 14.96 |
| 20 | Chris Buescher | 9 | 8 | 364 | 45.96 | 2 | 154 | 19.44 | 1 | 87 | 10.98 | 0 | 5 | 0.63 | 31 | 4.98 | 792 | 100.00 | 13.99 |
| 21 | Kevin Harvick | 9 | 3 | 208 | 27.01 | 2 | 119 | 15.45 | 1 | 39 | 5.06 | 0 | 4 | 0.52 | 7 | 1.13 | 770 | 97.22 | 16.50 |
| 22 | Brad Keselowski | 9 | 1 | 57 | 7.37 | 0 | 34 | 4.40 | 0 | 5 | 0.65 | 0 | 3 | 0.39 | 18 | 2.89 | 773 | 97.60 | 18.44 |
| 23 | Ty Gibbs | 6 | 2 | 129 | 23.41 | 0 | 18 | 3.27 | 0 | 3 | 0.54 | 0 | 1 | 0.18 | 9 | 1.45 | 551 | 69.57 | 18.75 |
| 24 | Erik Jones | 9 | 2 | 108 | 13.65 | 0 | 13 | 1.64 | 0 | 6 | 0.76 | 0 | 1 | 0.13 | 8 | 1.29 | 791 | 99.87 | 20.91 |
| 25 | Harrison Burton | 9 | 1 | 49 | 6.19 | 1 | 14 | 1.77 | 1 | 8 | 1.01 | 0 | 1 | 0.13 | 0 | 0.00 | 791 | 99.87 | 24.20 |
| 26 | Alex Bowman | 8 | 2 | 202 | 32.53 | 2 | 75 | 12.08 | 2 | 19 | 3.06 | 0 | 0 | 0.00 | 9 | 1.45 | 621 | 78.41 | 13.07 |
| 27 | Bubba Wallace | 9 | 2 | 64 | 10.74 | 1 | 17 | 2.85 | 0 | 12 | 2.01 | 0 | 0 | 0.00 | 0 | 0.00 | 596 | 75.25 | 19.71 |
| 28 | Ricky Stenhouse Jr | 9 | 1 | 71 | 9.20 | 0 | 13 | 1.68 | 0 | 2 | 0.26 | 0 | 0 | 0.00 | 1 | 0.16 | 772 | 97.47 | 22.71 |
| 29 | Ryan Preece | 3 | 0 | 21 | 8.20 | 0 | 2 | 0.78 | 0 | 0 | 0.00 | 0 | 0 | 0.00 | 0 | 0.00 | 256 | 32.32 | 17.66 |
| 30 | Ty Dillon | 9 | 0 | 52 | 7.73 | 0 | 31 | 4.61 | 0 | 7 | 1.04 | 0 | 0 | 0.00 | 0 | 0.00 | 673 | 84.97 | 20.31 |
| 31 | Aric Almirola | 9 | 0 | 33 | 4.52 | 0 | 11 | 1.51 | 0 | 3 | 0.41 | 0 | 0 | 0.00 | 4 | 0.64 | 730 | 92.17 | 17.38 |
| 32 | Corey LaJoie | 9 | 0 | 33 | 4.28 | 0 | 19 | 2.46 | 0 | 13 | 1.69 | 0 | 0 | 0.00 | 8 | 1.29 | 771 | 97.35 | 22.77 |
| 33 | Josh Bilicki | 7 | 0 | 10 | 1.69 | 0 | 1 | 0.17 | 0 | 1 | 0.17 | 0 | 0 | 0.00 | 0 | 0.00 | 590 | 74.49 | 25.66 |
| 34 | Andy Lally | 3 | 0 | 0 | 0.00 | 0 | 0 | 0.00 | 0 | 0 | 0.00 | 0 | 0 | 0.00 | 0 | 0.00 | 206 | 26.01 | 31.24 |
| 35 | Denny Hamlin | 9 | 0 | 150 | 19.38 | 0 | 78 | 10.08 | 0 | 60 | 7.75 | 0 | 37 | 4.78 | 18 | 2.89 | 774 | 97.73 | 16.89 |
| Driver | Races | T10 Fin | T10 Laps | T10% | T5 Fin | T5 Laps | T5% | T3 Fin | T3 Laps | T3% | Wins | Led | LL% | Fast Laps | FL% | Laps | Laps Run % | Ave Running Pos |
One response to “Front Runners – 2023 Verizon 200, Indianapolis Motor Speedway Road Course”
Where’s Denny Hamlin?